

Global Investment Outlook Q4 2026
Macro outlook and market implications
As we enter the final quarter of 2026, growth remains resilient, but the market backdrop has become less forgiving.
The main change is the mix of risks. Inflation remains stubbornly above central banks’ targets, oil has moved back above USD100 as geopolitical tensions persist, and the market is anticipating a more hawkish Federal Reserve. These risks have helped push bond yields notably higher.
Importantly, this is not just about oil or a new inflation scare. Longer term inflation expectations have actually stayed relatively stable. Instead, much of the move has come from higher real yields and rising term premia. That suggests the market is accepting that the old low rate world is less likely to return, and that a higher cost of capital must be reflected in asset prices.
So far, markets and economies have generally been able to take higher yields in their stride. Key to this has been strong corporate finances; the US profit share of national income is near post-war highs, and balance sheets have improved, which has helped keep credit spreads tight even as government bond yields have risen.
In the US, strong profits reflect two drivers – rapid AI investment driving technology sector earnings and tight control of labour costs providing a wider boost. At the same time, the household savings rate has declined, labour’s share of income has fallen, and spending has become more dependent on wealthier households.
So, while growth has been solid, continued resilience is likely to require profits holding up, stronger household incomes, a moderation in oil prices, and yields levelling off.
Outside the US, the picture is also mixed. Broadening out remains a key theme, with support from Europe, selected emerging markets and parts of Asia, but the path is likely to be volatile as higher real yields test valuations and concentration risk. China is no longer exporting deflation as broadly as before, especially in high-tech manufacturing, but weak domestic demand and spare capacity mean it can still act as a global disinflationary anchor.
Looking ahead, the key question is whether resilience can persist without creating more inflationary pressure or another sharp rise in real yields. If oil prices ease and income growth improves, broadening out can continue. But if inflation remains elevated, markets face a more challenging environment of tighter policy and greater volatility. The real yield is a key variable, particularly whether any further increases are driven by productivity or cyclical pressures.
Key themes

Click image to enlarge
Source: HSBC AM, October 2026. Any views expressed were held at the time of preparation and are subject to change without notice. While any forecast, projection or target where provided is indicative only and not guaranteed in any way. HSBC Global Asset Management accepts no liability for any failure to meet such forecast, projection or target. Diversification does not ensure a profit or protect against loss. The level of yield is not guaranteed and may rise or fall in the future. For informational purposes only and should not be construed as a recommendation to invest in the specific country, product, strategy, sector, or security.
Scenarios
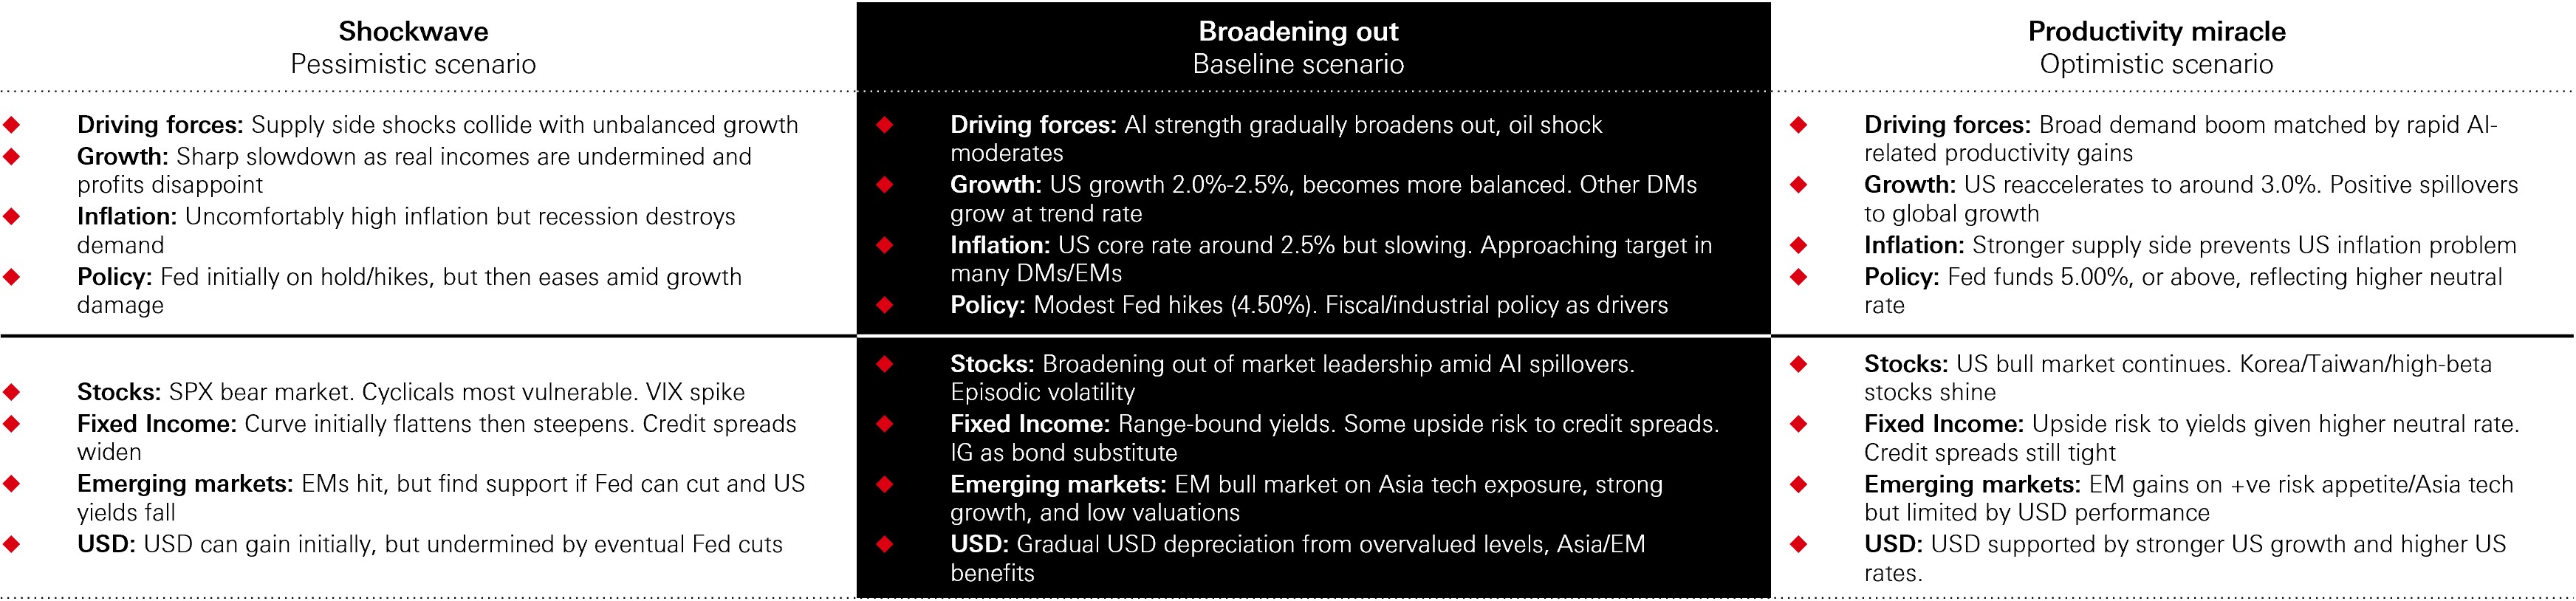
Our scenario framework explores how the macro and market landscape could evolve depending on whether the current resilience broadens out, productivity improves, or supply side risks intensify.
With inflation still above target, stronger growth is not automatically good news for markets. It is therefore more important to decipher whether further growth comes from supply expansion or simply more inflation.
Our central scenario remains ‘Broadening out’, in which the oil shock begins to fade, inflation drifts lower, and the economy becomes less dependent on a narrow AI and wealth effect engine.
In this scenario, US growth remains around 2.0 per cent-2.5 per cent, but the composition improves. AI investment continues, though less explosively, while non-AI investment contributes more. Consumption also becomes better supported by income growth rather than falling savings or rising asset prices.
Inflation still falls only gradually in this scenario. It remains above the Fed’s comfort zone, leaving the central bank likely to deliver two or three hikes to rebuild credibility, rather than start a full tightening cycle. For markets, this means broadening can continue, but with more friction, volatility and greater sensitivity to valuations.
Our upside scenario is a ‘Productivity miracle’. Here, AI related productivity gains arrive faster than expected and spread beyond the technology sector. This allows for stronger growth, wages and profits without the same inflationary pressure. Yields can still rise, but because higher productivity lifts the neutral rate.
A key point here is that a starting point of above-target inflation means stronger than expected demand would not necessarily be positive for risk assets – it would likely be met with more aggressive policy tightening. An optimistic scenario for risk assets requires positive supply side developments.
The downside scenario is ‘Shockwave’. Prolonged geopolitical disruption keeps oil elevated and turns a supply shock into a demand shock. Higher energy prices would squeeze real incomes and weaken confidence. Growth would slow sharply, inflation would stay sticky at first, and the Fed would then face a difficult trade off before cuts become possible later.
In a world of demand and supply shocks, we need to keep in mind that these scenarios cannot fully capture the range of possible outcomes facing investors.
Figure 1: Macro and market scenarios
Click image to enlarge
Source: HSBC AM, October 2026. Any views expressed were held at the time of preparation and are subject to change without notice. While any forecast, projection or target where provided is indicative only and not guaranteed in any way. HSBC Global Asset Management accepts no liability for any failure to meet such forecast, projection or target. Diversification does not ensure a profit or protect against loss. The level of yield is not guaranteed and may rise or fall in the future. For informational purposes only and should not be construed as a recommendation to invest in the specific country, product, strategy, sector, or security.
Market implications
Higher real yields, tighter valuations and more concentrated earnings make the next phase harder for investors to navigate.
The market has tolerated rises in government bond yields better than expected because profit growth has been strong and corporate balance sheets have improved, even as sovereign balance sheets have weakened. That helps explain why credit spreads have stayed tight. But it does not mean higher yields do not matter. There is still a level where real yields become a headwind for credit and risk assets, and the speed of the move may matter as much as the level.
For equities, the main challenge is the combination of higher real yields, concentrated earnings and demanding valuations.
Higher real yields are squeezing the equity risk premium, while investors are not being paid much for taking concentration risk in the most crowded parts of the market. The AI capex cycle remains powerful, but the next phase needs more evidence that spending is turning into sales, productivity and durable profits. Capex is still rising faster than sales, and that ratio cannot be maintained indefinitely.
The implication for the broadening theme is more selectivity is required about where it is expressed. Europe can still participate, while parts of Asia and emerging markets remain supported by AI-linked earnings and valuation opportunities. But EM is no longer one simple trade. Korea and Taiwan are closely tied to the AI hardware cycle, while China and India offer different earnings drivers and can provide useful diversification within the asset class.
Fixed income also calls for a more precise approach. The rise in yields looks more like a normalisation in real rates and term premia than a pure inflation scare, with longer term inflation expectations remaining relatively stable. That creates better income opportunities, but duration may be a less reliable hedge when fiscal concerns and stock-bond correlations are less favourable. High quality credit, selective private credit and securitised credit can therefore play a useful role as income sources and partial bond substitutes.
The dollar adds one final twist. A hawkish Fed has not automatically meant a stronger dollar, because the currency has also been pulled by fiscal concerns and relative rate moves elsewhere.
Overall, this is still an environment to stay engaged in, but not through broad beta alone. The focus should be on durable earnings, income, quality and regional diversification, with enough flexibility to use volatility rather than simply absorb it.
Figure 2: Views per asset class (▲ Positive / ↔ Neutral / ▼ Negative bias)

Click image to enlarge
Source: HSBC AM, October 2026. House view represents a >12-month investment view across major asset classes in our portfolios. Views reflect our long-term expected return forecasts, our portfolio optimisation process and actual portfolio positions. These views are for general information purposes only and do not constitute advice or a recommendation to buy or sell investments Any views expressed were held at the time of preparation and are subject to change without notice. While any forecast, projection or target where provided is indicative only and not guaranteed in any way. HSBC Global Asset Management accepts no liability for any failure to meet such forecast, projection or target. Diversification does not ensure a profit or protect against loss. The level of yield is not guaranteed and may rise or fall in the future. For informational purposes only and should not be construed as a recommendation to invest in the specific country, product, strategy, sector, or security.
Top of mind
Is euro securitised debt ready to sit in institutional allocations?
For many investors who lived through 2008, ‘securitisation’ still carries uncomfortable associations with opaque structures and poor underwriting. In Europe, however, the market has evolved significantly over the past 15 years. Stronger regulation, greater transparency and more robust underwriting standards have reshaped the asset class, raising legitimate questions about whether euro securitised debt can now play a more mainstream role in fixed income allocations.
Regulatory reform has been central to this shift. European simplicity, transparency and standardisation (STS) rules have tightened disclosure and structural requirements, while market practices around collateral quality and deal design have also improved. The result has been robust historical credit performance for senior European tranches: there have been no recorded defaults on European AAA CLO tranches and very low defaults in the post‑’CLO 2.0’ era, according to S&P Global.
Changes to Solvency II add another dimension. The European Commission has amended the insurance capital framework so that the treatment of securitisation is more closely aligned with underlying risks. Senior STS assets are now treated more in line with covered bonds and similarly rated corporate debt, while senior non‑STS tranches also benefit from more favourable risk measures.
This recognises the maturity of the European market and reduces previously punitive capital disincentives for holding high‑quality structures.
Despite these developments, euro securitised debt remains under‑represented. Using insurers as a proxy for the wider market, European insurers hold less than 1 per cent of assets in securitised products versus roughly 15 per cent in the US. The gap reflects memories of the crisis, patchy liquidity in some segments, and the complexity of analysing underlying pools. While there is an opportunity to bridge the gap, any increase in allocations is likely to be gradual and concentrated in senior, well‑understood transactions.
The macro environment is mixed but not unfavourable. Many securitised structures pay floating‑rate coupons, which can be useful in a higher‑for‑longer rate setting.
At the same time, the relatively short spread duration of securitised debt can limit sensitivity to moderate spread moves, potentially supporting a more stable return profile.
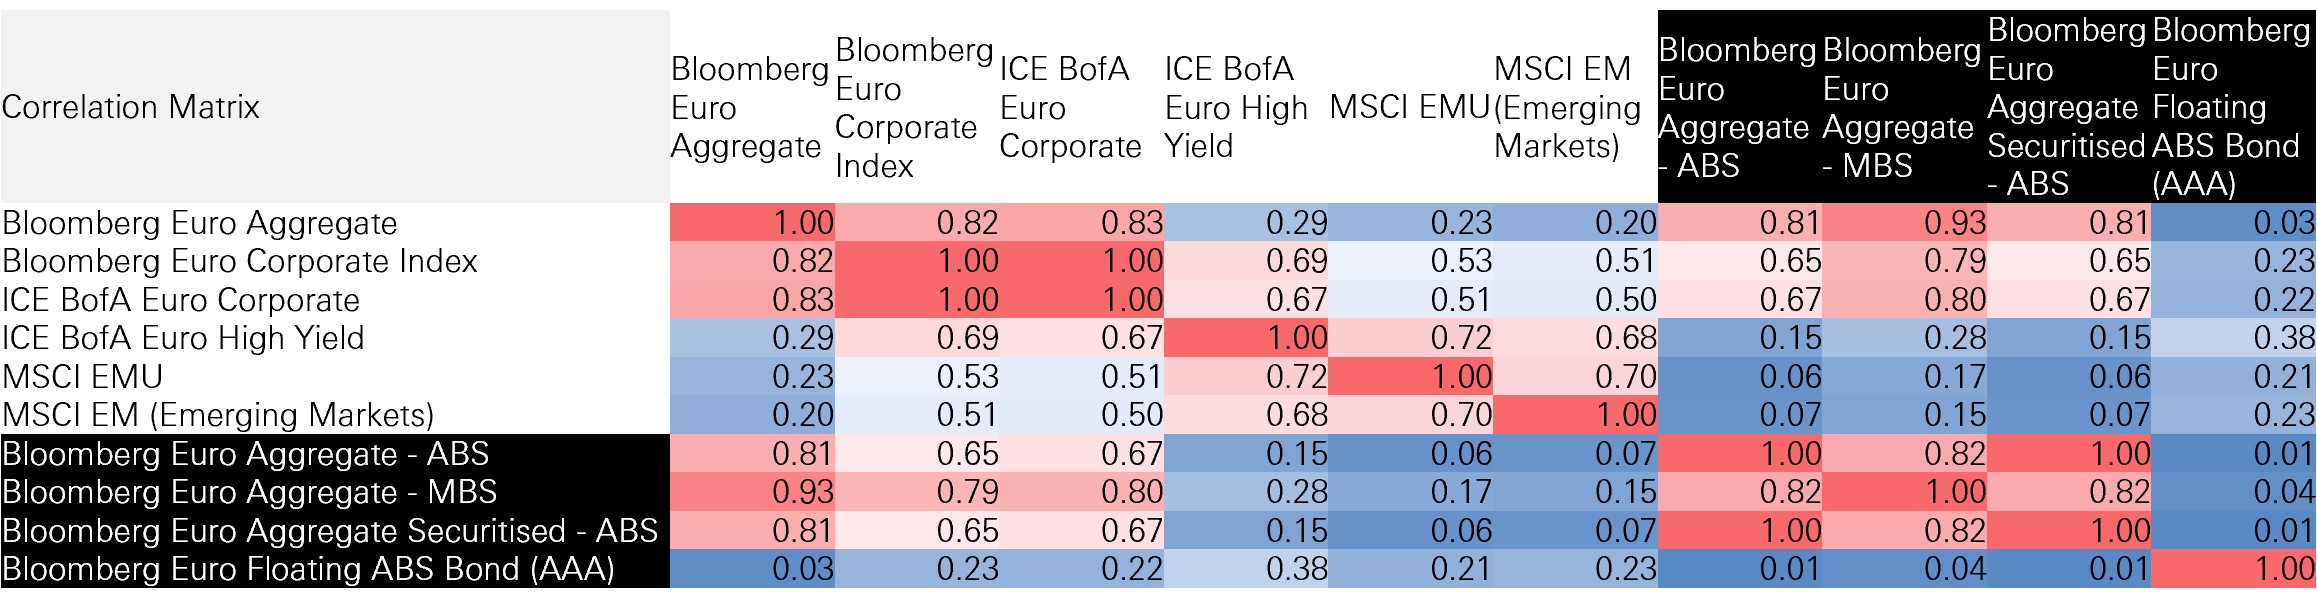
From a portfolio‑construction standpoint, diversification is its main strength. Over the period examined, securitised assets have shown materially lower correlations with European and emerging market equities than investment‑grade corporate credit. A blended allocation across ABS, RMBS and CLOs allows investors to access differentiated consumer, mortgage and corporate loan risk, and to calibrate structure and seniority to specific objectives.
Taken together, these developments suggest that euro securitised debt would merit renewed scrutiny from institutional investors as a potentially useful complement to traditional corporate credit.
Figure 1: Correlation matrix between securitised debt markets and other assets
Click image to enlarge
Source: FactSet. End of month euro total returns. Data as of September 2006 to July 2026.
Mega-cap IPOs: Growth engine or late-cycle warning?
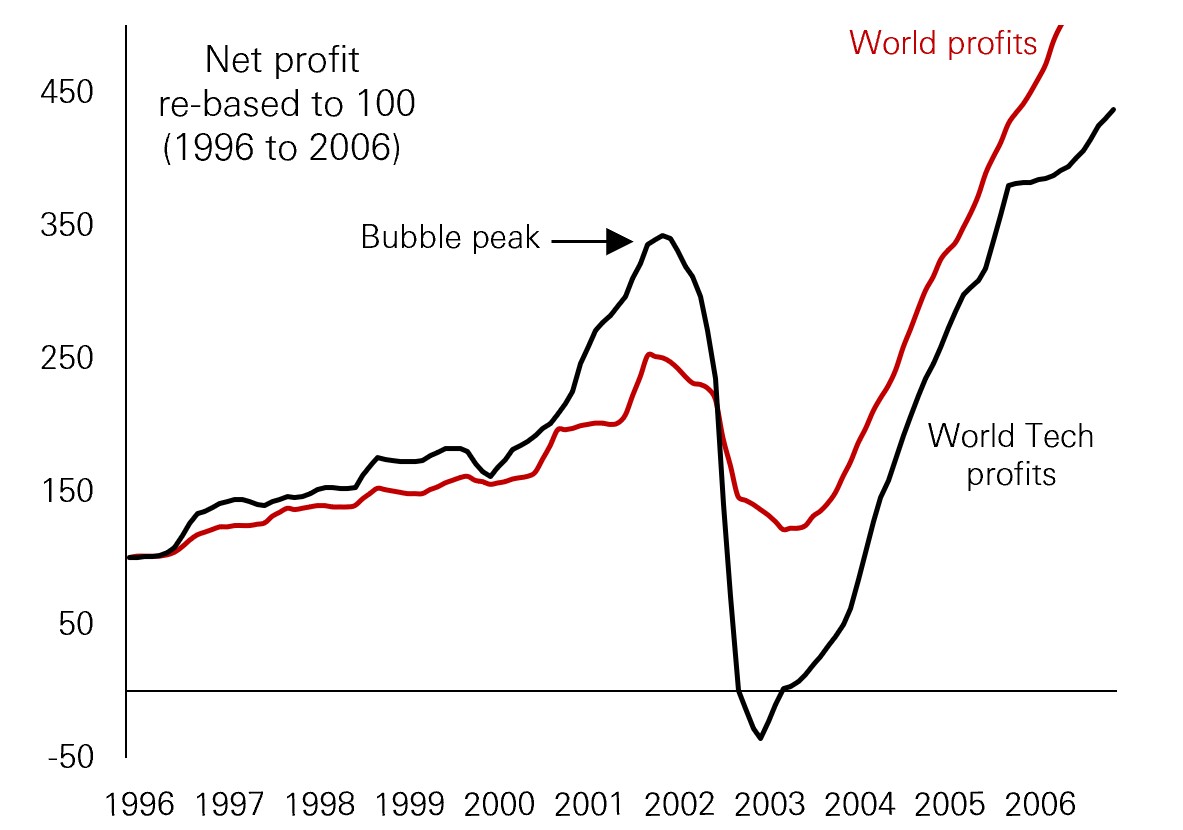
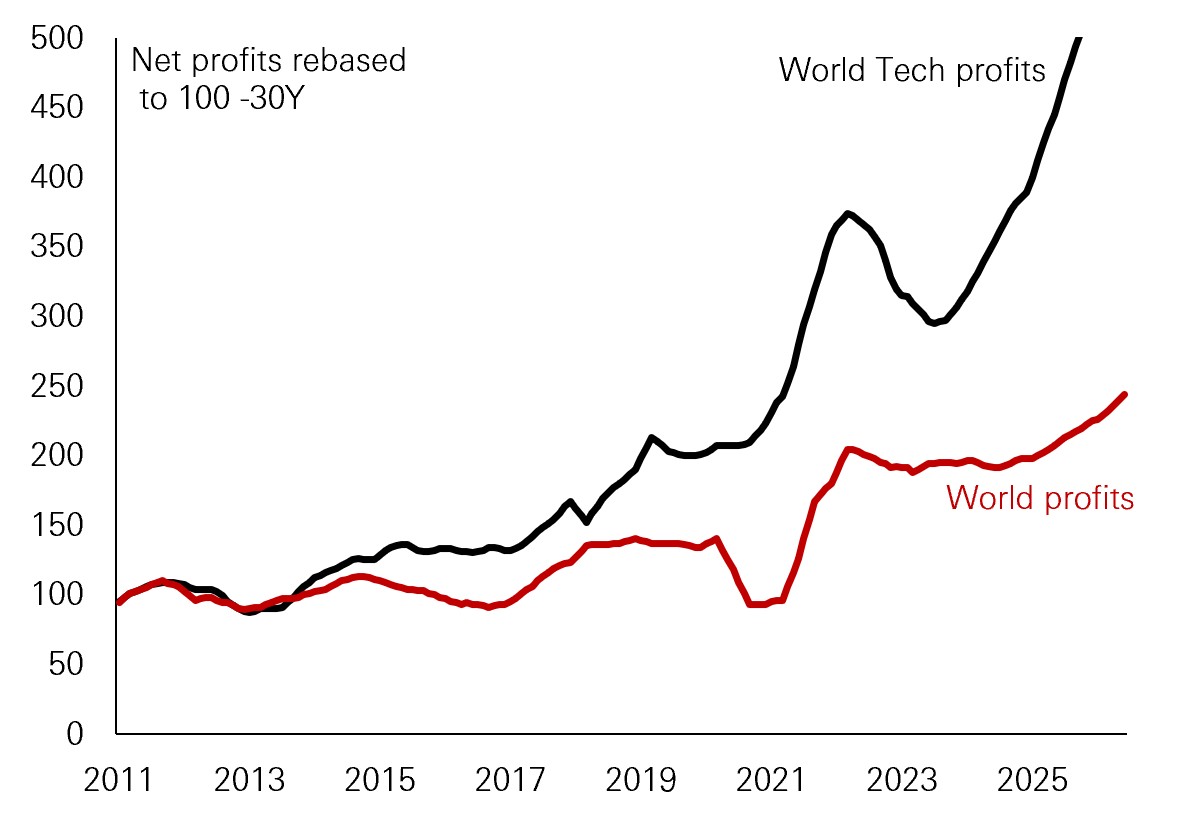
Mega-cap IPOs are returning to global markets, and with them a familiar mix of excitement and anxiety for investors. 2026 is shaping up as a year of large new listings, not just from US tech giants but increasingly from emerging markets, with China’s burgeoning technology sector stepping onto the global stage. The backdrop is unusually strong. Global tech profits are roaring ahead of the wider market, with US tech net margins close to 27 per cent – roughly double their 2000 peak and almost triple the long-run global tech average. Massive AI-related capex is reinforcing confidence around earnings: four of the largest US hyperscalers have flagged combined 2026 capex of close to USD 800bn, an 80 per cent increase year-on-year.
Figure 1: 2000 bubble – tech versus world profits
Click image to enlarge
Past performance does not predict future returns.
Source: Refinitiv, DataStream, HSBC AM, June 2026
A sizeable share of that spending circulates within the tech ecosystem, boosting suppliers from memory chips to networking equipment. This profit and capex cycle supports the case for more equity issuance. After a long era of cheap money and de-equitisation via buybacks, higher funding needs and elevated valuations can make IPOs and follow-on offerings attractive ways to finance growth. It is no coincidence that one hyper-scaler has already tapped equity markets to help fund AI investment. Yet history warns against complacency. Previous IPO waves – from the dot-com boom to the post‑pandemic SPAC cycle – show how quickly hype can outrun economics.
In the late 1990s, insiders aggressively sold into strength as lock-up periods expired, while retail flows peaked near the top.
Figure 2: Current cycle – tech versus world profits
Click image to enlarge
Past performance does not predict future returns.
Source: Refinitiv, DataStream, HSBC AM, June 2026
More recently, many IPO and SPAC investors who bought after the initial surge faced negative returns once optimism faded. Today, technology valuations in some regions look stretched on metrics such as price-to-book, while Chinese tech still trades at a discount. This supports a case for broadening exposure beyond US mega‑caps, particularly given the structural under‑allocation to the rest of the world and the large inflow gap between US and non‑US equity funds since 2020.
Investors should carefully consider how they participate in mega‑cap IPOs. The discipline framework is familiar: keep fundamentals, not fear of missing out, at the core of decisions; treat lock‑up expiries and insider selling as important risk signals; and favour selective bottom‑up stock picking within genuinely diversified portfolios.
Mega-cap IPOs may mark a new phase of re-equitisation, but they do not change a timeless reality: in every cycle, some transformative technologies endure – many individual IPO stories do not.
Is the oil shock a turning point for emerging market debt?
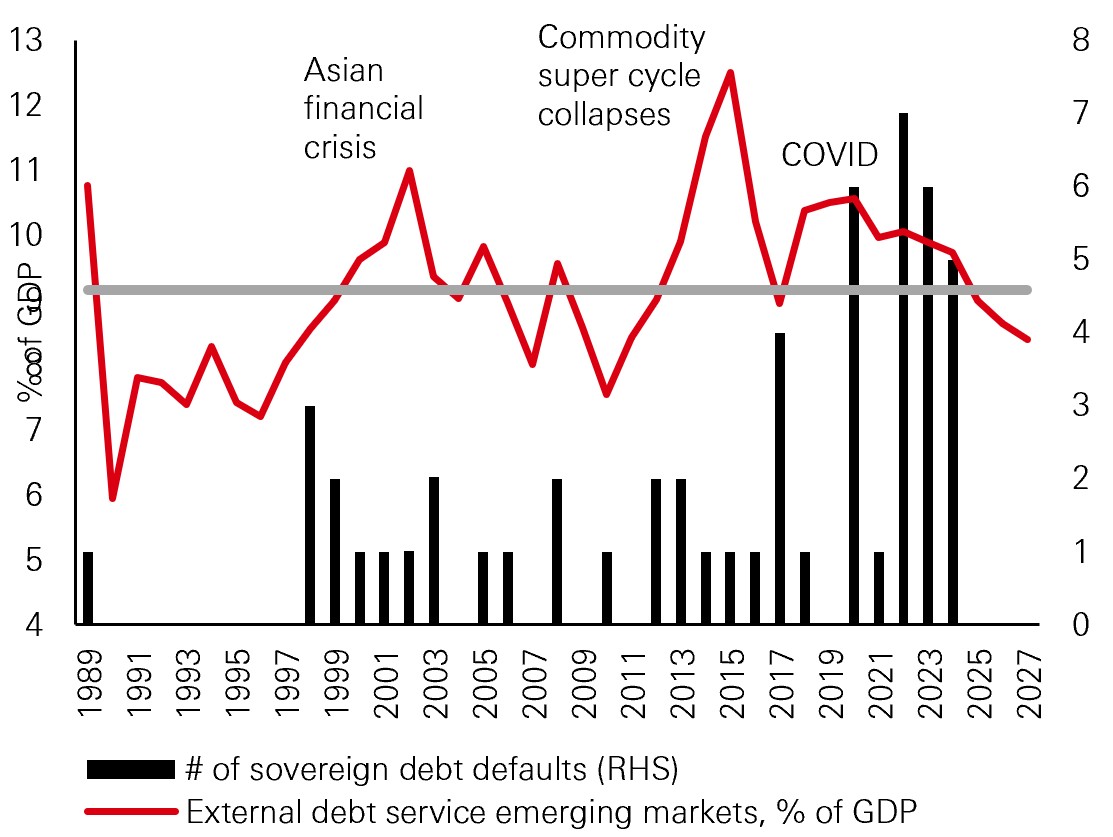
Higher oil prices are uncomfortable for many emerging market (EM) economies. They raise import bills, weaken current accounts, pressure currencies and push up inflation, particularly where food and fuel dominate household budgets.
The Middle East conflict has also highlighted broader vulnerabilities: the Strait of Hormuz is a key route not only for crude, but for refined products, fertilisers and gases such as helium that feed into agriculture, semiconductors and healthcare. A prolonged disruption would therefore ripple through global supply chains.
Figure 1: External debt imbalances and resilience
Click image to enlarge
Past performance does not predict future returns.
Source: Refinitiv, DataStream, HSBC AM, June 2026
Yet EM entered this shock from a stronger starting point than previous episodes. External debt service burdens are near multi‑decade lows as a share of GDP, thanks to deeper local currency markets, reduced reliance on hard currency borrowing, and post‑Covid restructurings that have improved debt profiles in several frontier economies. Sovereign ratings outlooks have generally shifted in a more positive direction, and aggregate external vulnerabilities remain below the levels historically associated with systemic stress.
More importantly, EM is far from homogeneous. Asia contains several large energy importers – Korea, Vietnam and the Philippines – where the policy trade‑off between protecting growth and containing inflation is sharpest.
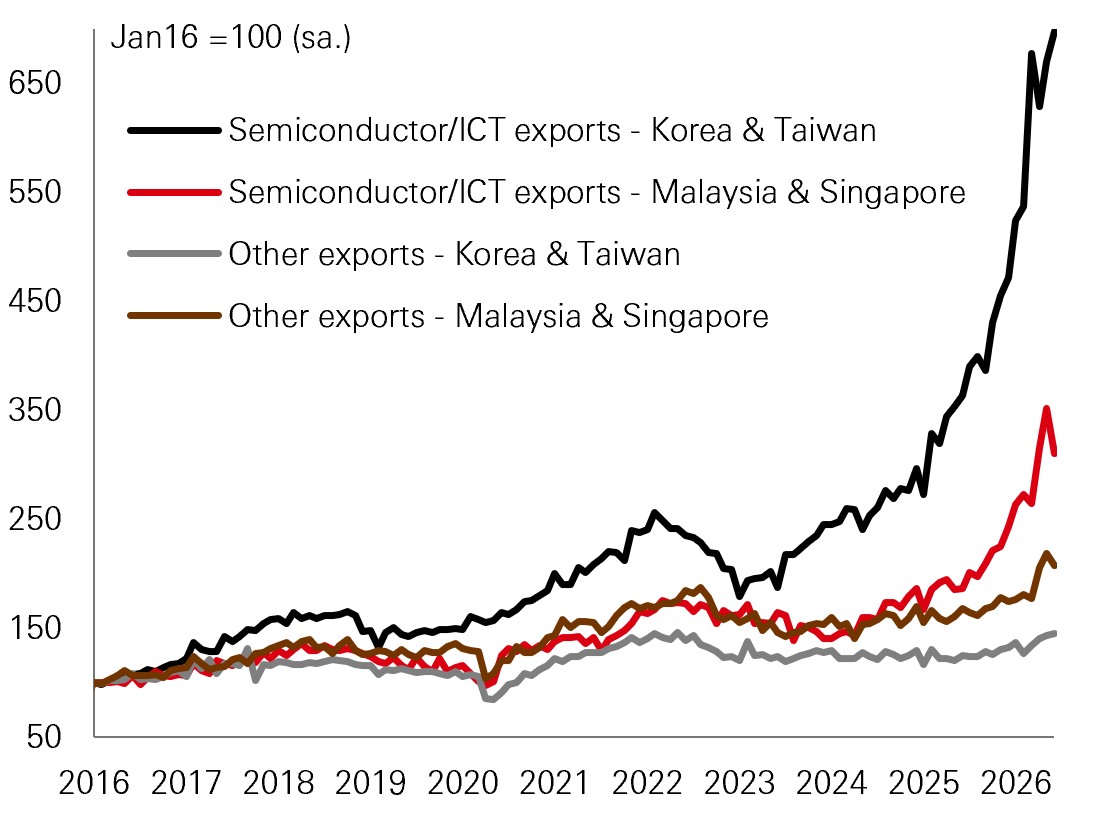
Figure 2: Export value (USD)
Click image to enlarge
Past performance does not predict future returns.
Source: Refinitiv, DataStream, HSBC AM, June 2026
Governments have used subsidies, reserves and diversified imports to cushion the shock, but these tools carry growing fiscal costs and cannot be sustained indefinitely. In contrast, Latin American exporters such as Brazil and Colombia enjoy natural offsets from higher oil prices.
Two structural trends help balance near‑term risks. First, the artificial intelligence cycle is lifting exports in technology‑heavy economies, including Korea, Taiwan, China and parts of ASEAN, providing a growth buffer against energy headwinds. Second, the drive for energy security is accelerating investment in renewables, grids, nuclear and electrification across Asia, turning stable and affordable electricity into a competitive advantage.
For bond investors, the implication is clear: the EM story is intact, but the winners are changing. Net commodity exporters with credible policy frameworks, and countries that combine manageable energy exposure with strong technology or metals exports, may be relatively well placed in this environment. At the same time, EM assets remain sensitive to developed market rates and the US dollar, so global liquidity will continue to shape returns.
Is Europe the quiet force behind the global AI boom?
The global AI narrative is dominated by a small group of US hyperscalers, leading semiconductor firms and platform companies. Yet the AI ecosystem ultimately rests on hard infrastructure: large data centres, power connections, cooling systems, specialised machinery, precision components and extensive copper wiring. Many of these inputs are supplied by European‑listed companies. They tend to be mission‑critical industrial and technology providers rather than consumer‑facing brands. As a result, they often sit deep in the value chain and rarely feature in headline AI stories.
As AI deployment scales, capex on equipment, power and infrastructure should grow, and Europe is well positioned to participate in this spend. European equities give asset allocators access to AI’s structural expansion that is less concentrated in a narrow group of technology names. Exposure is instead anchored in diversified industrial and infrastructure supply chains. For portfolios already tilted towards US growth, this can offer a complementary route into the theme and help reduce concentration risk.
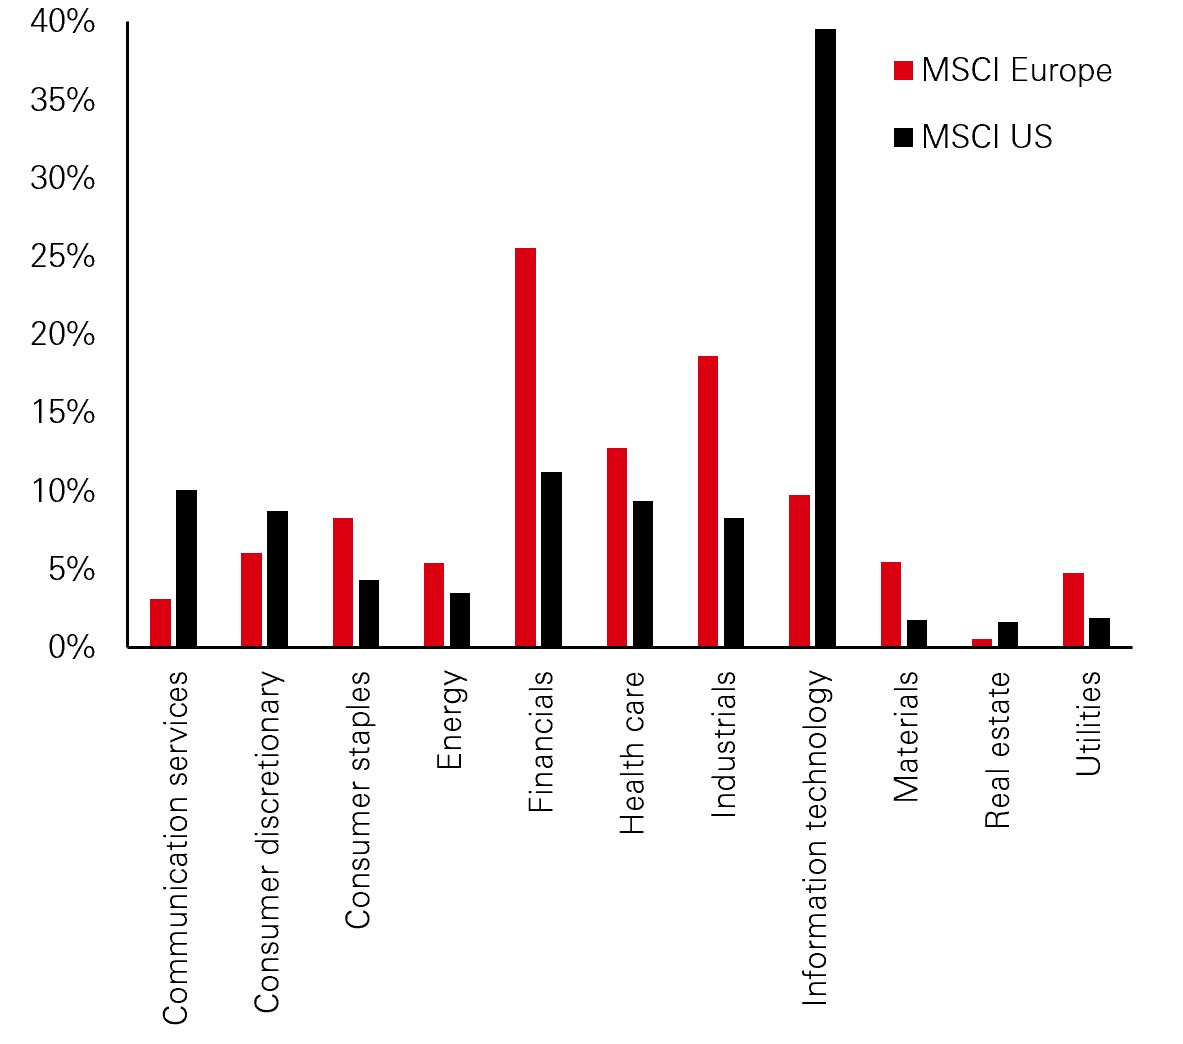
The investment case for Europe extends beyond AI, however. The region’s equity market spans industrials, financials, healthcare, consumer brands, energy, utilities and many technology‑related suppliers. This produces a more balanced sector profile than several other major markets, which can be an advantage for allocators seeking diversification across cycles and themes, rather than relying on a single driver of returns.
Revenue diversification adds an additional layer. European companies are strikingly global in their revenue mix. Only around 45 per cent of sales are generated within developed Europe and just 22 per cent in home markets, with a substantial share of earnings coming from the US and Asia. Investors can therefore access global demand trends and AI‑related end markets via European listings, while operating within the region’s regulatory and governance framework. This can be helpful for strategies that need global exposure but maintain regional risk limits.
Figure 1: Europe versus US equity sector weightings
Click image to enlarge
Past performance does not predict future returns.
Source: MSCI, HSBC Asset Management. Data as of 30 September 2026
Finally, it is important to note that fundamentals are supportive. The Q2 earnings season was stronger than expected: 31 per cent of companies beat forecasts, and estimates were revised upwards thereafter, with a net 10 per cent balance of upgrades over downgrades. Europe also remains at the forefront of innovation by breadth, with 12 economies in the Global Innovation Index top 20 and six in the top ten.1 Innovation clusters in applied engineering, research and specialist supply chains support this base.
Set against these positives are familiar risks. Europe is exposed to energy prices, political developments and the global growth cycle. A sharp slowdown would weigh on its internationally oriented firms.
Overall, however, the region is benefiting from AI infrastructure build‑out and offers broad sector and geographic diversification, resilient earnings and a wide innovation base. Even as the European equity story has evolved, valuations remain broadly lower relative to many other major markets, suggesting the opportunity might still be undervalued.
How might Asia private credit fit into global allocations?
Global private credit portfolios have traditionally been concentrated in the US and Europe. That concentration has brought scale and depth, but as economic cycles, policy settings and growth drivers become more fragmented, relying on the same markets and borrower profiles can leave portfolios exposed to increasingly similar risks.
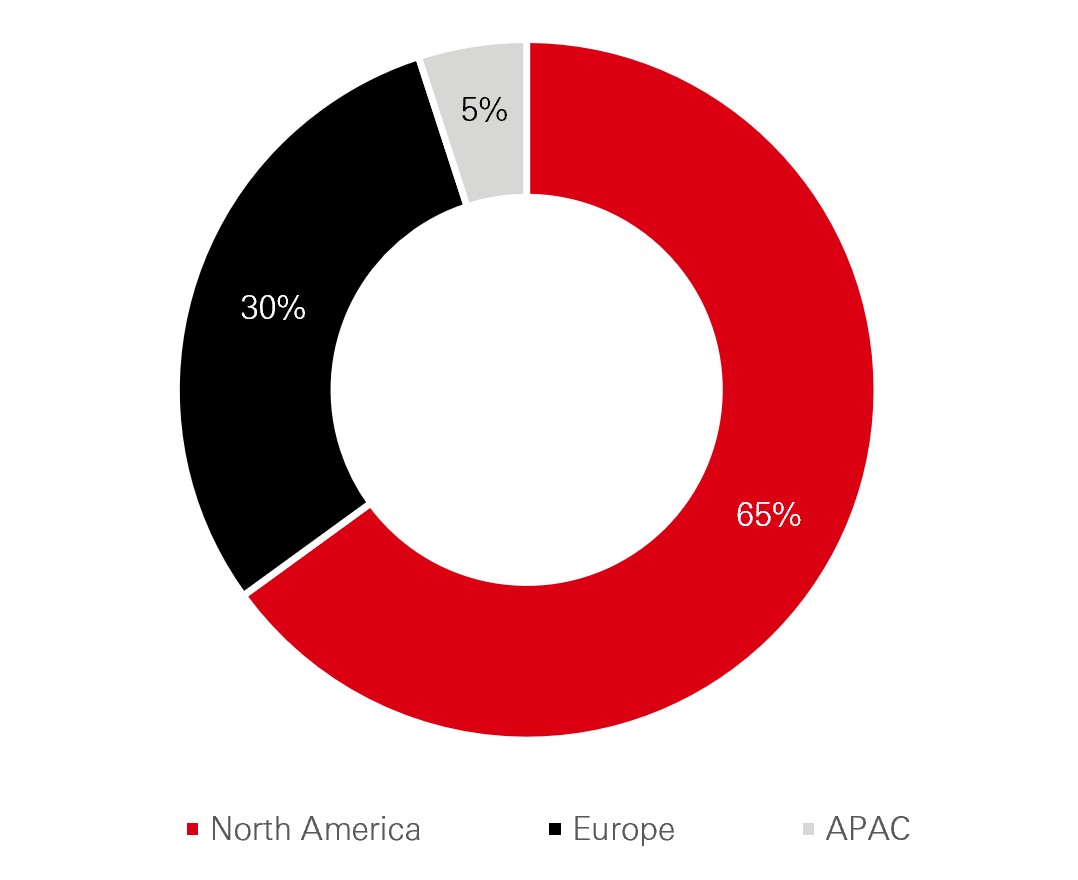
Asia private credit remains relatively overlooked, largely because the market is still small compared with the region’s economic weight. Asia accounts for around 40 per cent of global GDP and roughly 60 per cent of forecast future GDP growth, yet only about 5 per cent of global private credit assets under management.
Figure 1: Underweight APAC private credit
Click image to enlarge
Past performance does not predict future returns.
Source: Preqin & HSBC Asset Management Analysis (June 2026)
This gap reflects how credit has historically been supplied rather than a lack of financing demand.
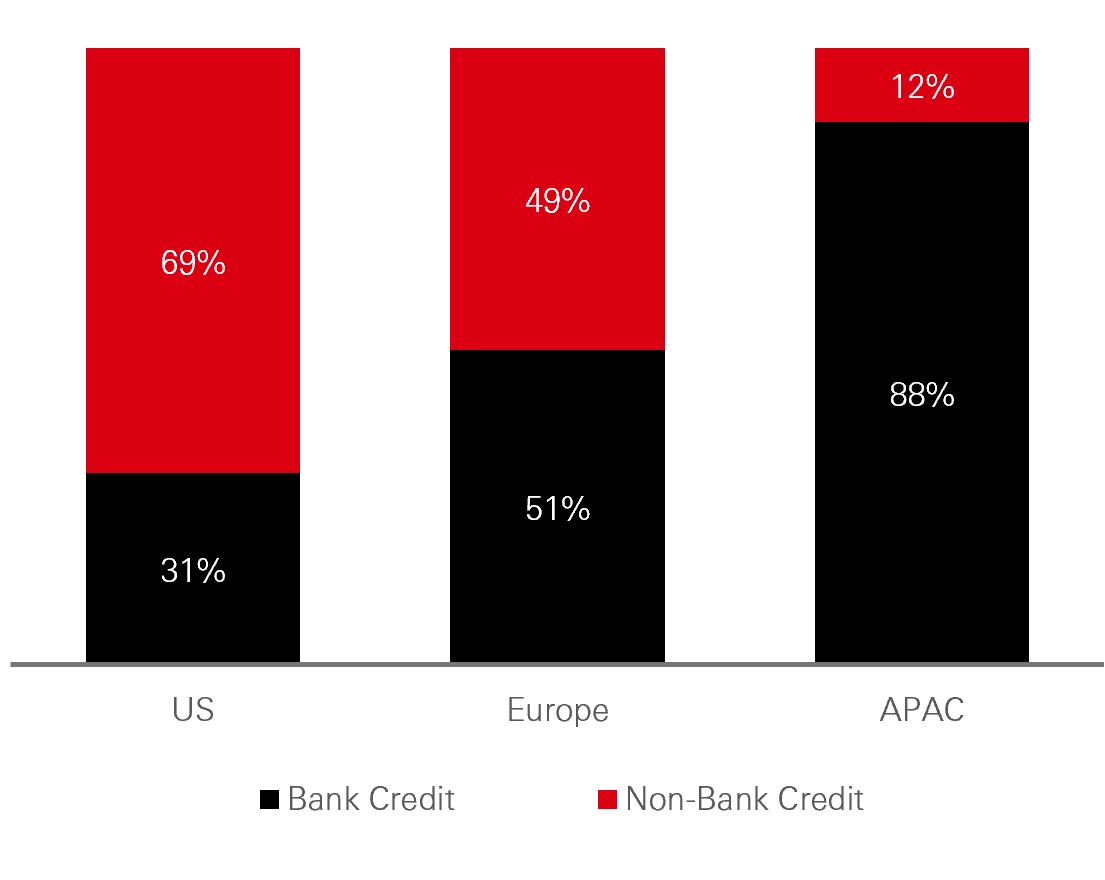
Credit provision in Asia is still predominantly bank-led. Banks account for around 88 per cent of regional credit supply, compared with 51 per cent in Europe and 31 per cent in the US. That model tends to work well for large companies with conventional borrowing needs, but can be less suited to more flexible or bespoke capital requirements. Mid-market companies, sponsor-backed transactions and businesses seeking acquisition, growth or transitional capital can therefore remain underserved.
The supply of private credit is also relatively limited. There are around 744 private credit funds in Asia, compared with more than 2,100 in the US and 1,300 in Europe.
Figure 2: Sizing The SME Funding Gap (USD trillions)
Click image to enlarge
Past performance does not predict future returns.
Source: Bank of International Settlements (December 2025)
At the same time, demand for flexible capital is increasing, driven by cross-border M&A, digital infrastructure, energy transition and supply-chain investment. The combination of fewer funds and rising demand can support differentiated lender economics. In parts of the performing mid-market, Asia private credit has, in recent years, offered yields around 200–400bps above comparable US and European opportunities, alongside leverage that can be one to two turns lower. Shorter duration, stronger documentation, enhanced collateral and lender protections can also influence the risk–return profile. These terms do not necessarily reflect higher underlying credit risk; they also stem from a less crowded market, more bespoke transactions and the added complexity of operating across different jurisdictions.
That complexity underscores that Asia is not a single credit market. It comprises a range of legal systems, regulatory regimes and business cultures. For global portfolios, this means Asia private credit can complement rather than replace US and European exposure, adding different borrower, sector and geographic risk drivers.
Fixed Income Deep Dive
Funding the AI frontier
The focus is shifting from AI winners and losers to companies that have secured the necessary funding and those that still need to raise it.
With combined hyperscaler capital expenditure expected to exceed USD 5 trillion between 2026 and 2029, the AI build out is moving beyond what operating cash flow alone can comfortably fund. Free cash flow for the higher quality hyperscalers is expected to trough around 2027 before recovering, while weaker participants face greater pressure. The next phase will therefore rely increasingly on external capital.
For credit investors, that changes the question. The underlying AI investment case may remain intact, but a sustained rise in borrowing can still create a more difficult technical backdrop for spreads. The unsecured bond market remains the main source of external funding so far, with investment grade hyperscalers having issued around USD 250 billion across seven currencies. A further USD 250 billion of issuance is expected in 2027, with potential upside if investment plans continue to increase.
Figure 1: Combined hyperscaler capex, FY26-FY29 (USD bn)
Click image to enlarge
Source: HSBC Asset Management, Bloomberg, S&P, September 2026.
Can the assets support the debt?
Large funding requirements do not necessarily mean poor economics. Much depends on the assets being financed and how quickly they can generate cash. Servers and networking equipment, for example, can reach breakeven in less than three years, compared with useful lives of around five to six years. Buildings, cooling systems and power infrastructure last considerably longer and can support several generations of equipment. Most AI capacity is also being contracted for at least five years, giving stronger issuers greater visibility over the revenues against which they are borrowing.
Monetisation can also come through several channels. Hyperscalers can rent compute directly to AI labs and enterprises, while their own models can generate additional demand for cloud infrastructure.
Cheaper open models may put pressure on individual AI lab pricing, but they could also accelerate adoption. More AI usage still requires compute, storage, networking and security, allowing infrastructure providers to benefit even if the model market becomes more fragmented.
Supply is visible, but difficult to size
The direction of travel is clearer than the exact amount of borrowing. A top down approach that assumes around 30 per cent of hyperscaler capex is funded with unsecured debt produces a materially larger funding requirement than building issuance issuer by issuer. Hyperscalers plan over several years and continue to hold substantial cash balances, giving them flexibility over when and how they raise capital.
Even so, issuance is likely to remain elevated. Strong fundamentals and heavy bond supply can coexist as companies may remain highly creditworthy while investors demand more spread simply to absorb repeated new issuance.
At the same time, the funding picture is becoming more complicated than bond supply alone. As leases, guarantees and other off-balance sheet structures become more important, where the economic obligation ultimately sits becomes just as important as how much debt is issued.
The debt investors do not always see
Traditional leverage captures bonds, loans and recognised lease obligations. However, the AI build out increasingly creates commitments that do not initially appear as conventional debt. A data centre lease, for example, may already be contractually committed even though the facility is still being built. Residual value guarantees can similarly create an economic liability if the future value of a data centre or pool of chips falls below the amount guaranteed.
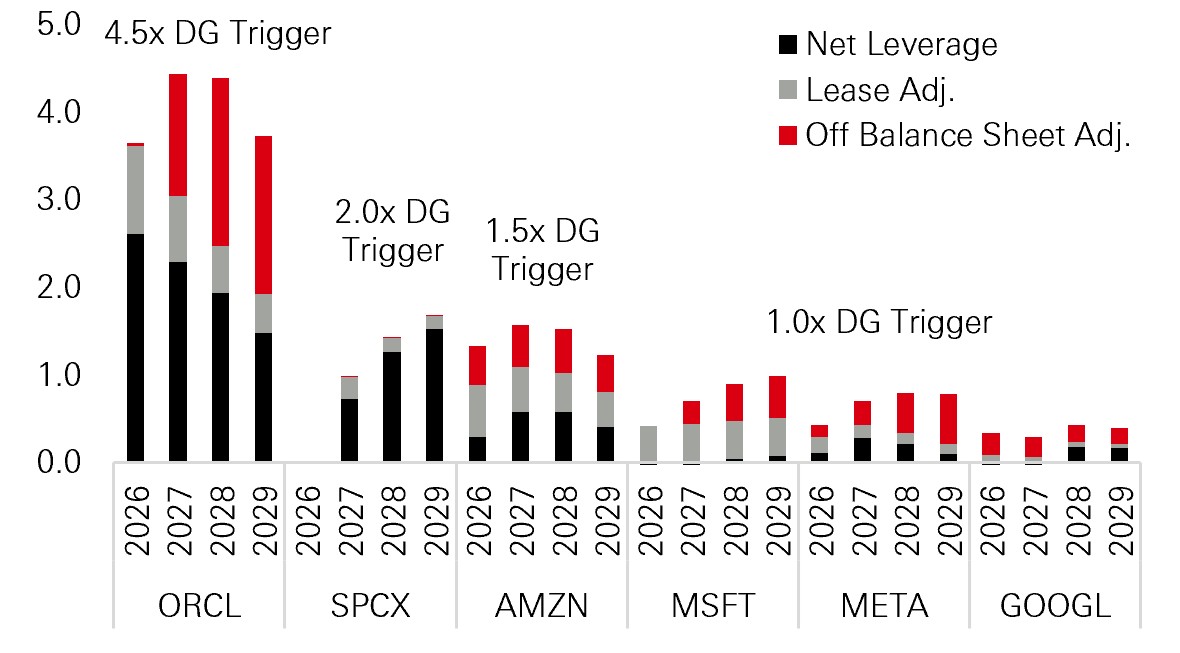
The important point is that these adjustments do not automatically imply rating pressure. For some of the larger hyperscalers, incorporating off-balance sheet commitments can bring adjusted leverage closer to rating agency thresholds even while underlying credit fundamentals remain strong. Yet this need not translate into a downgrade, as robust earnings, growing contracted revenues and the productive use of new borrowing can provide capacity to absorb higher leverage.
Figure 2: All-in net leverage by hyperscaler
Click image to enlarge
Source: HSBC AM, company filings, S&P. Data as of September 2026.
Across the sector, rising leverage needs to be assessed alongside earnings, cash flow, liquidity and the pace at which new capacity begins to monetise.
Funded versus unfunded growth
For much of the past 18 months, credit markets have rewarded exposure to AI growth with relatively little distinction between how that growth was financed. However, a company with committed capital, contracted revenues and sufficient liquidity to complete its development pipeline is fundamentally different from one that still requires repeated access to capital markets.
This is where the distinction between funded and unfunded credits becomes useful. Within data centres, collateral backed structures can provide additional protection because loan-to-value ratios tend to fall as construction is completed.
Investment grade tenants, residual value protection, amortising debt and revenues that begin once a facility is delivered can also reduce dependence on future financing. Therefore, it is key to understand how much additional financing still must be raised before the business plan becomes self funding.
Financing risk is spreading through the ecosystem
That issue is no longer confined to hyperscalers. Semiconductor manufacturers and other participants in the AI supply chain are increasingly supporting customers through equity investments, guarantees and other financing arrangements.
Strategically, this can expand demand for their own products. From a credit perspective, however, it creates a second layer of exposure. If AI demand slows, operating earnings can weaken at the same time that financing commitments become more likely to crystallise.
The scale of these commitments can be large, but their impact depends on several factors such as whether they are contingent or already drawn, how quickly they build, the value of the underlying collateral, and the issuer’s ability to generate free cash flow over the same period.
This is why the structure, timing and location of the funding increasingly determine the credit outcome. The distinction becomes even clearer when the same investment cycle is viewed across different regions.
One technology cycle, three funding models
The AI build out is global, but the financial systems supporting it are very different. That matters because it determines where bond supply appears, who carries the leverage and how quickly financing pressure reaches public credit markets.
- US: public markets absorb the build out
- Asia: investment without the same bond supply
- Europe: infrastructure without the same financing burden
The US sits at the centre of the capex cycle and has relied heavily on deep public capital markets to finance it. Large investment grade issuers can access unsecured bonds at scale, while leases, project structures and other off-balance sheet arrangements provide additional channels.
That breadth of funding is a strength, but it also means the credit market has to absorb a sustained increase in supply. The key US risk is whether earnings and monetisation can keep pace with the amount of capital being raised, while investors continue to absorb repeated issuance without requiring materially wider spreads.
Asia presents a very different model. It is already the second largest data centre market and capacity could more than double by 2030. Associated infrastructure investment could reach around USD 500 billion, compared with roughly USD 2.5 trillion in the US.
Yet much of that capital does not reach public bond issuance. Banks, project finance and private capital fund a large share of physical infrastructure, while tenants and hyperscalers fund much of the chip and server investment and utilities finance the power requirement.
Chinese project loans can price below 3 per cent for 10–15 years, compared with around 6 per cent on shorter maturities elsewhere in the region. Chinese hyperscalers also obtain more than half of their debt from banks - around four times the share of US peers. This allows substantial investment to take place without creating the same public bond supply pressure seen in the US.
That helps explain why Asian AI related credit spreads have remained tight. It also creates a clear risk to watch. If funding gradually migrates from banks into public bonds, today’s benign supply backdrop could change materially.
Europe sits at the other end of the spectrum. Its data centre market is smaller and more constrained by power availability, grid connections, land and planning. Around 65 per cent of existing capacity is concentrated in the major FLAP-D hubs, while hyperscalers directly account for only around a quarter of continental European capacity.
More importantly, around 70–80 per cent of European AI investment is being undertaken by US hyperscalers. Europe is therefore hosting an increasing share of the infrastructure without European corporates carrying the same financing burden. Bank lending remains the main funding source, while AI related issuance accounts for only around 9 per cent of euro investment grade supply and securitisation is only beginning to emerge.
That shifts the European credit story towards infrastructure enablers — semiconductor equipment, power technology, networking and electrical systems — where AI related revenues are increasing but direct capex requirements are generally more manageable. The constraint is often valuation rather than balance sheet capacity.
What next
The regional framework also makes the risks easier to identify. In the US, weaker than expected monetisation would matter because leverage is increasingly being built against future earnings and contracted demand. Continued regulatory and permitting delays could slow the timing of projects, although so far local resistance has generally meant delays rather than outright prohibitions.
In Asia, a shift from bank finance towards public bonds would create a new source of public bond supply, while tighter sanctions or export controls could undermine investment sentiment. In Europe, the risk is less about funding stress and more about whether valuations already reflect too much of the expected benefit.
Taken together, the AI build out is becoming a funding story before it becomes a balance sheet problem. For fixed income investors, considering who has secured the capital, who bears the contingent liabilities, how much future issuance is still required and whether the resulting spread adequately compensates for that funding risk are the key questions.
That is where the distinction between funded and unfunded credits becomes increasingly important — and where a common technology cycle is creating very different opportunities across global credit markets.
Multi-asset Deep Dive
AI earnings and portfolio resilience
AI earnings remain a macro-relevant driver. The challenge is to capture the upside while remaining resilient if the cycle turns.
AI has become much more than a technology sector story. Exceptional earnings growth and a large investment cycle are now influencing global equity indices, business investment and, increasingly, the broader economic outlook.
The starting point is an unusually concentrated market. US equities have outperformed both world and emerging market equities since the launch of ChatGPT, but excluding technology, media and telecoms, that relative performance would have been negative. A similar pattern is visible in emerging markets, where semiconductor heavy markets have accounted for much of the recent strength.
Concentration beneath the index
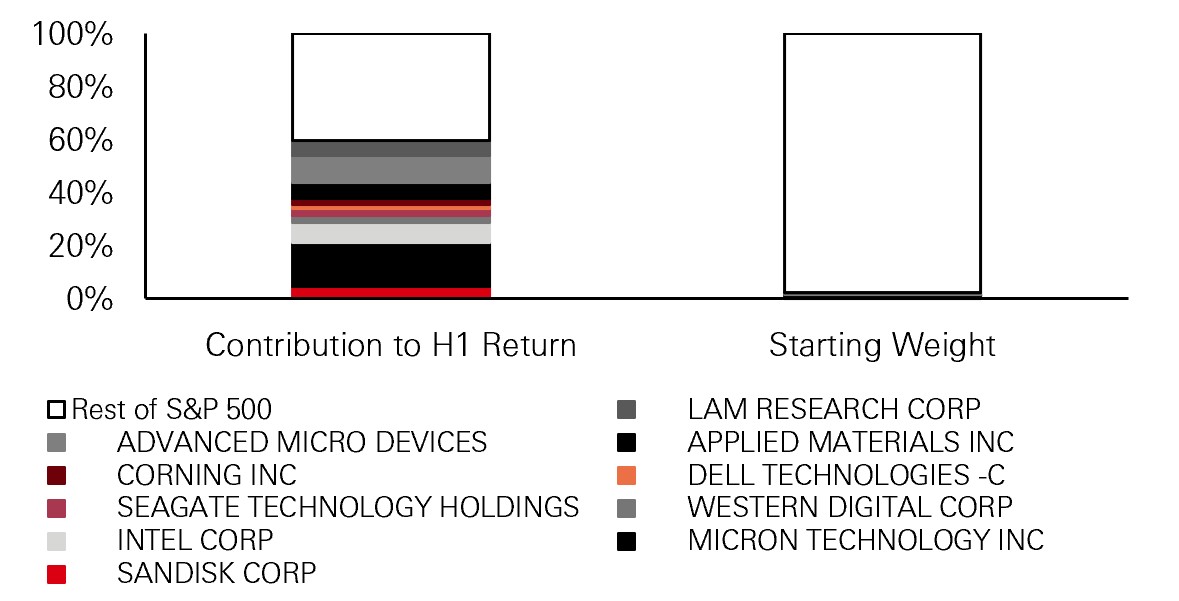
The ten largest contributors to the S&P 500's first half return represented only 2.5 per cent of the index at the start of the year but generated around 60 per cent of its total return. In Asia, excluding Taiwan and Korea from index returns would have turned an actual first half gain of 22 per cent into a decline of around 8 per cent. However, this is not simply momentum without fundamentals.
Earnings have done much of the work. US technology net profit margins are around 27 per cent, roughly three times their long run average. Of the approximately 10.3 per cent upward revision to S&P 500 earnings during the first half, around 7 percentage points came from technology. The same distinction is visible in emerging markets. Consensus expects EM earnings per share to grow by around 55 per cent in 2026, but excluding two large semiconductor companies reduces that to roughly 24 per cent. Headline earnings strength therefore remains highly concentrated.
Figure 1: Top 10 S&P 500 returners: starting weight versus contribution to H1 return (per cent)
Click image to enlarge
Source: HSBC Asset Management, September 2026
Earnings, rather than rerating
Earnings momentum helps explain why conventional valuation measures can look less stretched than the scale of the rally might suggest.
Prices have risen sharply, but earnings expectations have risen alongside them, leaving forward multiples broadly stable.
The rally therefore has fundamental support, but valuations increasingly depend on that earnings strength persisting. Behind those earnings sits an investment boom that has become economically significant. US private fixed investment is around 18.5 per cent of real GDP, while technology related investment accounts for approximately 5 per cent of GDP, above the highs reached during the dot-com period. IT investment contributed around 0.8 percentage points to quarterly real GDP growth in Q1, its highest contribution since the 1990s.
A capex cycle that can still run
There are good reasons why investment could continue. Analyst capex estimates have risen by roughly 80 per cent over the past six months, while cumulative spending by the six of the largest hyperscalers could approach USD 5 trillion by 2030. Returns on incremental investment remain high for parts of the industry, and previous technology investment cycles continued for several years after reaching comparable contributions to growth.
A record level of investment is therefore not, by itself, evidence of a turning point. The more important question is how much current market pricing depends on exceptional earnings and investment lasting.
Valuations depend on earnings persistence
Longer term valuation measures look more demanding than forward multiples suggest. The cyclically adjusted price-to-earnings ratio sits in the top percentile of its history and is approaching levels seen during the dot-com period. A reasonable explanation for this premium is that profitability is considerably stronger today. The vulnerability lies less in current profitability than in how long markets assume those margins can persist.
Forward price-to-earnings ratios make this point particularly clearly. They remain close to historical averages across many markets because earnings expectations have risen even faster than share prices. Forward price-to-earnings can therefore remain comfortable while earnings expectations continue to rise, but the apparent valuation cushion can disappear quickly if those expectations weaken. The risk lies in both the direction and durability of earnings as even a near term loss of momentum could expose how much current valuations depend on exceptional profitability persisting.
Earnings still need to become cash
The question of durability becomes more important when moving from accounting profits to cash flow. The AI build out was initially easier to finance because the largest hyperscalers had substantial net cash positions and strong free cash flow. As investment has accelerated, however, free cash flow coverage has fallen, and external financing has become increasingly important. The five largest hyperscalers have added around USD 350 billion of debt over the past five years.
If investors become less willing to absorb continued issuance, financing costs rise. That could eventually constrain capex, with implications extending beyond technology because AI related investment is now large enough to influence suppliers, credit markets and broader economic activity.
Depreciation catches up
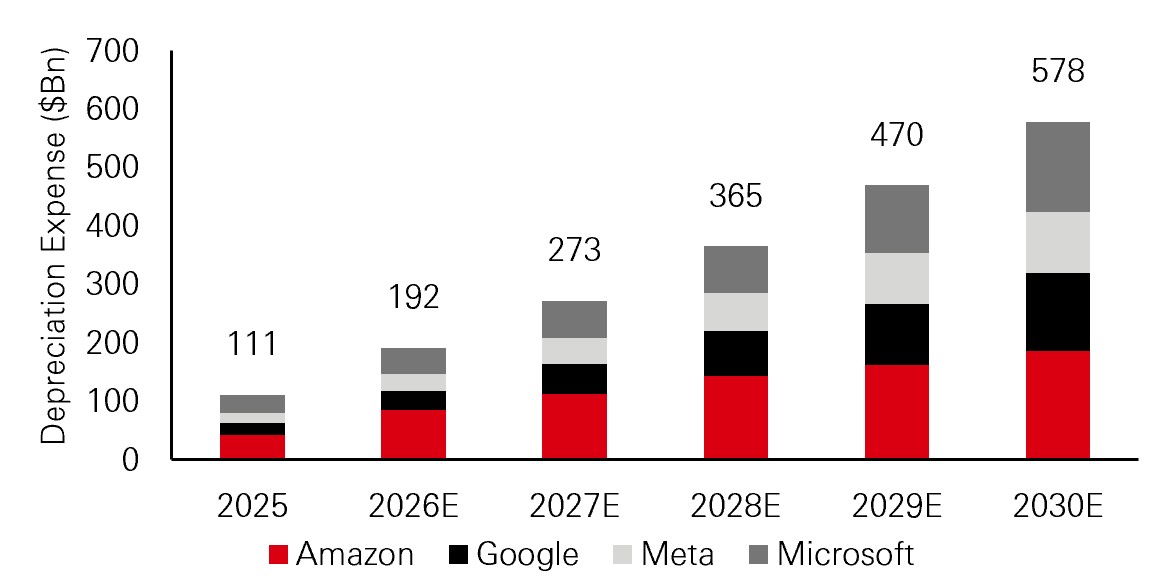
There is also a timing issue within the earnings themselves. Capex is paid upfront, while depreciation is recognised gradually over the useful life of an asset. As hyperscalers become more infrastructure intensive, their depreciation charge is set to increase substantially. For the four hyperscalers shown in figure 2, combined depreciation is projected to exceed USD 575 billion by 2030, compared with less than USD 400 billion of combined net income in 2025. Small changes in assumptions about how long servers and other equipment remain useful can have a meaningful impact on reported earnings.
Figure 2: Hyperscaler depreciation outlook (USD bn)
Click image to enlarge
Source: Bloomberg consensus estimates for 2026-2030, aggregate forecast submitted by sell-side analysts, 2025. Actuals are as reported from each company's income statement, HSBC Asset Management, August 2026.
More broadly, the current cycle allows suppliers of compute to recognise profits upfront, while buyers recognise the associated depreciation over a longer period. That raises the hurdle for revenue growth as today’s investment increasingly feeds through into future expenses.
One increasingly interconnected earnings cycle
A further complication is the growing financial interdependence across the AI ecosystem. Hyperscalers, semiconductor companies and model developers increasingly act as suppliers, customers and investors in one another. Contracted revenue backlogs across the major hyperscalers now total around USD2.1 trillion, with roughly half linked to OpenAI and Anthropic. There is growing concern that this concentration makes it harder to identify the ultimate source of demand and creates a common factor across businesses that initially appear different.
That common factor extends into emerging markets. Around 55 per cent of SK Hynix's revenues and 40 per cent of TSMC’s revenues are linked to hyperscalers, while SK Hynix, Samsung and TSMC together represented close to 30 per cent of MSCI Emerging Markets at the end of August. The market has also begun to price that dependence asymmetrically, with EM semiconductors becoming more sensitive to negative moves in US mega cap technology than to positive ones. For multi-asset portfolios, what looks like diversification across regions may still contain substantial exposure to the same earnings and capex cycle. That increases the importance of portfolio construction because now the aim is to manage shared factor exposure without relying on a precise call on the cycle’s peak.
Run-ups tell us more about risk than returns
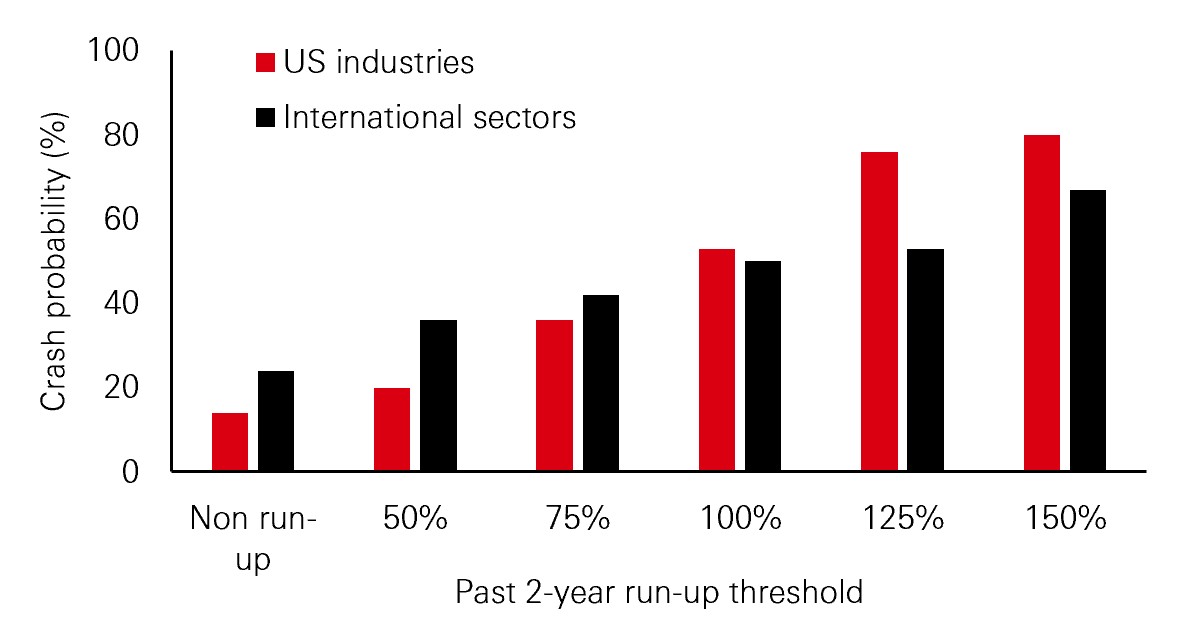
Large price gains do not provide a reliable timing signal. Historical research covering US industries since 1928 identified 40 episodes in which prices rose at least 100 per cent both in absolute terms and relative to the broader market over two years. What changes more clearly is the distribution of risk. The unconditional probability of a 40 per cent industry drawdown over two years is around 14 per cent. Following a 100 per cent run up, it rises to approximately 53 per cent, and after a 150 per cent rise to around 80 per cent. Importantly, there is no equivalent increase in the probability of another exceptional upside outcome.
Recent markets provide a useful illustration. The Philadelphia Semiconductor Index rose by around 130 per cent over two years and Korea’s KOSPI by around 160 per cent; both have subsequently experienced drawdowns of around 40 per cent or more.
Figure 3: Crash probability vs prior price run-up1
Click image to enlarge
Source: HSBC Asset Management, September 2026
That does not turn the framework into a timing signal as history also contains many examples of rallies continuing well beyond the point at which they first appeared extreme.
Even in episodes that eventually crashed, meaningful gains often occurred before the peak. That is why the framework is not useful for market timing, but it can help determine how much concentration risk a portfolio should be willing to carry.
Diversify what the benchmark no longer diversifies
The first response is to restore diversification that increasingly concentrated indices may no longer provide. Sector diversification is one route. During the 2022 technology drawdown, US information technology fell around 30 per cent, while consumer staples and healthcare were broadly flat. During the 2000-01 technology correction, technology declined by more than 50 per cent, while staples returned around 16 per cent, financials 7 per cent and healthcare 6 per cent.
The same principle applies across investment factors. Quality, dividends and value can behave differently from long duration growth. During the 2022 sell-off, global value declined around 19 per cent peak-to-trough compared with roughly 30 per cent for the broader global equity index. None of these exposures removes equity risk, but they can reduce dependence on the single factor currently driving much of index performance. Factor diversification is important when geographic diversification still carries the same underlying semiconductor and AI capex exposure.
Add convexity, but recognise its cost
A second layer is explicit convexity such as exposures designed to outperform during large risk asset drawdowns. Options based protection or risk managed equity strategies can provide that asymmetry, but insurance has a cost. Because the timing of a drawdown is unknowable, maintaining protection through a prolonged rally can create persistent negative carry. Thus, it is important to make a distinction between hedging the tail and paying for protection at any price. One approach is to pair explicit convexity with diversifiers such as gold, which can help offset some of the cost of maintaining protection. The aim is not to eliminate exposure to AI. The capex cycle is real, current profitability is strong, and the investment boom could continue for longer than many expect. Attempting to exit precisely before a reversal risks giving up substantial upside.The more durable multi-asset response is to reduce reliance on any single earnings engine while retaining participation in it. Diversification can lower a portfolio's dependence on concentrated equity leadership, while selective convexity can address the left tail that diversification alone may not fully protect against.
Equity Deep Dive
Beyond AI leadership
Equity markets are still being supported by strong earnings, but higher bond yields and concentrated leadership are raising the bar for the next phase of returns.
Earnings delivery remains at the heart of the equity market story. More than 70 per cent of US companies beat expectations in the Q2 reporting season, while earnings estimates have also been revised higher, particularly in emerging markets. Yet the backdrop is becoming less forgiving. Higher government bond yields have compressed the equity risk premium, raising the return hurdle investors require to take on additional equity risk.
From here, earnings increasingly need to grow faster than prices if valuations closely tied to the AI investment cycle. Kare to remain supported, putting greater focus on where those earnings are coming from. Equity performance has broadened from the very narrow cohort since early 2025, but parts of it remain orea and Taiwan have benefited from exceptional semiconductor demand, while technology accounts for around three quarters of this year’s emerging market profit growth. However, there are signs that the picture could become more balanced.
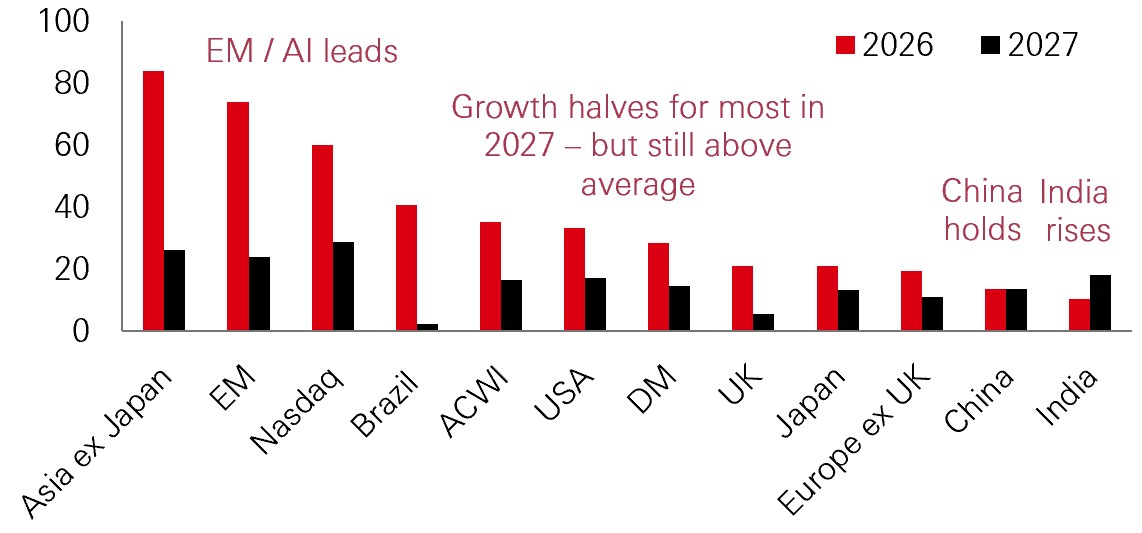
Consensus expects earnings growth to moderate across most markets in 2027, although China is expected to remain relatively stable and India to improve after a difficult period. Defensive sectors such as healthcare, real estate and consumer staples also show steadier earnings profiles as some of the exceptional growth elsewhere begins to normalise.
Figure 1: Global country EPS growth in 2026 and 2027
Click image to enlarge
Source: Refinitiv, IBES, HSBC AM, September 2026
Furthermore, valuations reinforce the need to look beneath the headline. Global forward price-to-earnings multiples remain close to long-run averages, partly because earnings have risen so quickly. Price-to-book measures tell a less comfortable story, with valuations in some of the biggest AI beneficiaries approaching levels last seen around the technology bubble. Korea and Taiwan, for example, can still appear inexpensive on earnings-based measures while looking much richer relative to their asset base. China and India sit at the other end of that spectrum, with considerably less demanding price-to-book valuations.
Strong earnings can keep forward P/E ratios looking reasonable even as the price investors are paying for the underlying asset base rises sharply. The apparent valuation cushion therefore depends increasingly on earnings continuing to deliver. Earnings growth does not necessarily need to accelerate further, but profits need to remain strong enough to support valuations that leave less room for disappointment.
This highlights the acute issues with AI companies. With so much earnings momentum now linked directly or indirectly to the investment cycle, the next phase depends less on how much capex is announced and more on whether the infrastructure being built generates the revenues, productivity and cash flows needed to sustain it. Hyperscaler capex continues to rise, and announced projects suggest the investment cycle could remain elevated for several more years. But the economics of that spending are also changing as the buildout moves from basic capacity towards greater utilisation and monetisation.
There are already signs of that shift. Older cloud contracts are being repriced in a much stronger demand environment, newer generations of chips are increasing the amount of inference that can be delivered, and the composition of capex is moving towards revenue generating compute rather than simply land, power and data centre shells. AI is also pulling through demand across existing cloud and software businesses, meaning the return on investment cannot be measured only through AI labelled revenues.
From investment to monetisation
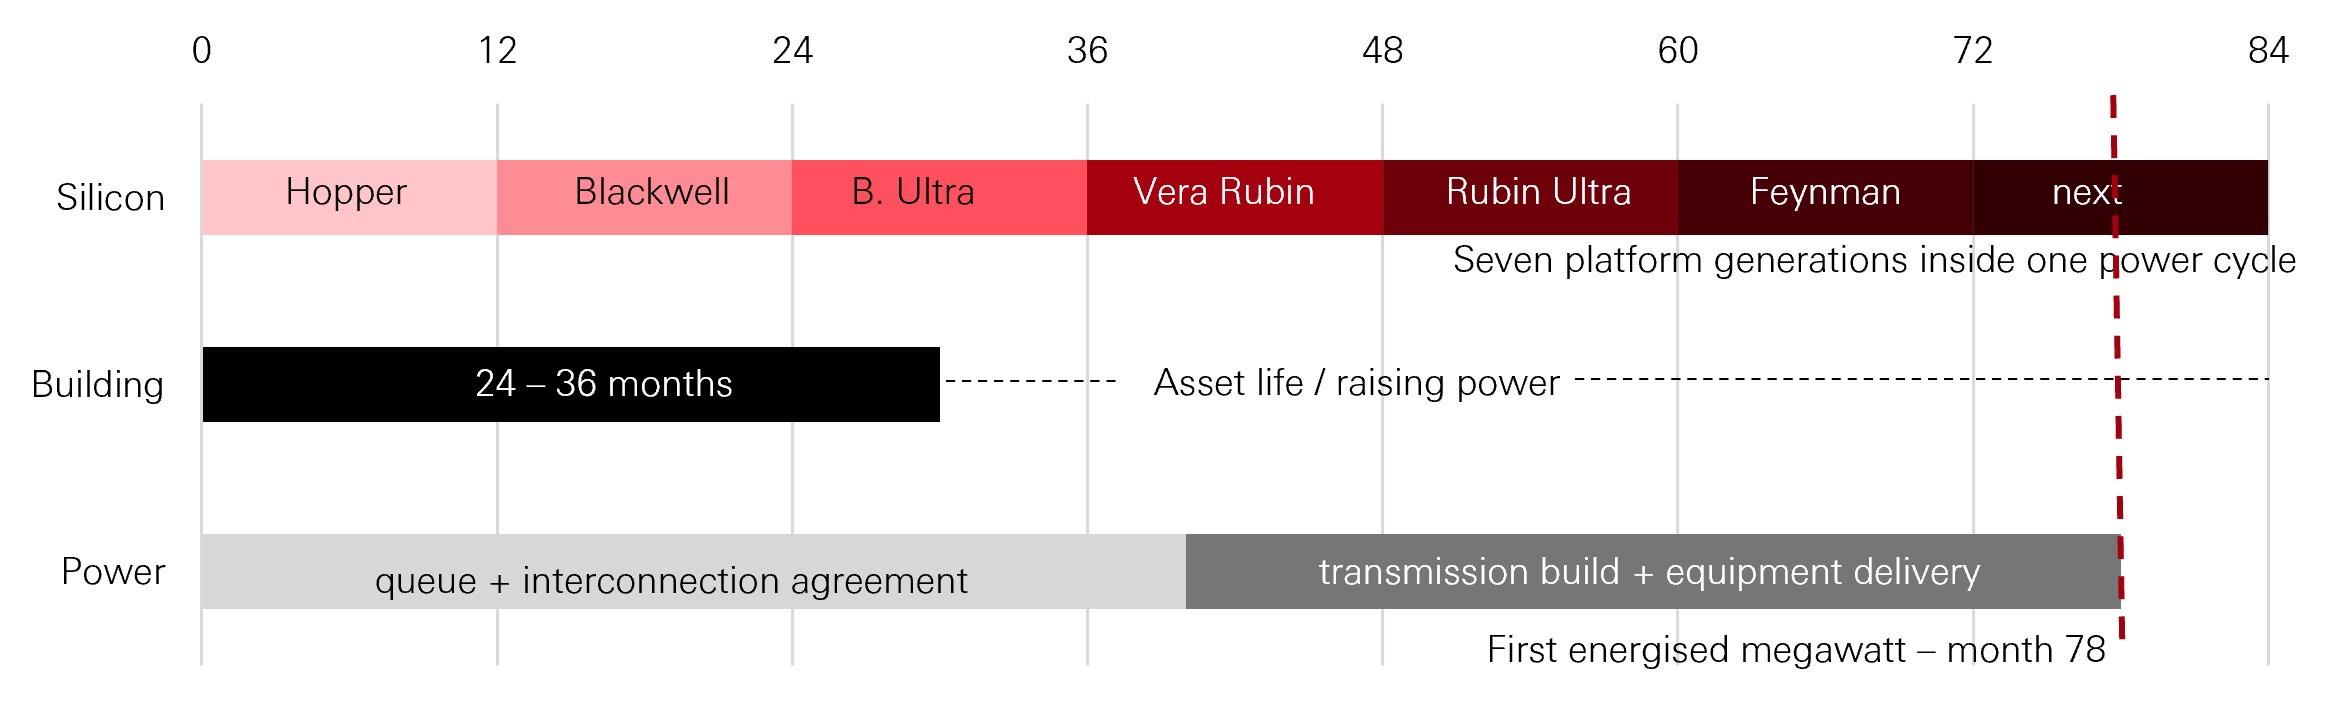
One way to understand the economics of the AI build out is through its three different investment clocks. The first is silicon – chips and servers – which can move through technology cycles in roughly a year. The second is the data centre building itself, where construction can take around two to three years but the underlying shell, cooling and network infrastructure can support several generations of compute. The third is power, where securing grid connections and bringing new capacity online can take considerably longer. A single power development cycle can therefore span several generations of chips.
That timing mismatch can also influence project economics, as infrastructure designed around today’s compute requirements may only become operational after several technology generations have passed. It also helps explain why headline capex can look unusually high. Hyperscalers are investing simultaneously in short duration compute and physical infrastructure with much longer timeframes. Compute hardware accounts for roughly 60 per cent of the cost of a data centre, while the remainder goes into buildings, power systems, cooling and network connections. Assessing the entire investment against the replacement cycle of GPUs risks overstating the capital burden because much of the infrastructure being built today can support multiple generations of technology and workloads.
Illustrative modelling suggests that, with high utilisation, the economics can still be attractive. Potential data centre returns could reach around 19–20 per cent and server payback periods could be roughly three years.
Figure 2: Three clocks – the mismatch that defines the cycle
Click image to enlarge
Source: Data Gravity Substack, HSBC AM, September 2026.
These are assumptions rather than guaranteed outcomes, but they help explain why hyperscalers remain willing to invest while demand is visible. Project announcements also suggest capex could continue rising through 2028, although spending can be delayed or resized if demand changes.
Those economics, however, depend heavily on utilisation and pricing. The industry is still early in the build out, and the eventual business models and returns remain uncertain. If demand develops more slowly than expected, projects can be delayed, resized or cancelled, while lower utilisation would extend payback periods. The key question is therefore not simply how much capacity is being built, but whether durable demand emerges quickly enough to absorb it.
Token prices can be a useful indicator of demand but are not perfect. Cheaper models can consume more tokens to complete the same task, while enterprise users may pay different prices depending on where workloads are hosted. Falling unit prices therefore do not automatically imply weaker infrastructure revenues; utilisation and the total cost of completing a task matter as well.
The bigger uncertainty is how demand is funded. A meaningful share of future capacity is being committed to a relatively small number of frontier model developers, leaving parts of the investment cycle dependent on their ability to continue raising capital as well as growing revenue. Usage is rising rapidly, but sustainable returns ultimately require those workloads to translate into cash generating demand. Greater model competition, falling unit prices and changes in the regulatory or policy environment could all alter the economics over time. None of these necessarily undermines the near term investment case, but they create potential sources of volatility as markets reassess the timing and scale of monetisation.
The next phase is likely to be more selective than the broad AI trade of recent years. As the technology matures, differences in utilisation, funding, pricing power, architecture and business model should become more important. The investment cycle can remain strong without every company in the ecosystem benefiting equally, while disappointments around demand, financing or policy could periodically test valuations that already assume substantial earnings delivery.
For investors, this raises a broader question: if AI remains an important engine of market returns but concentration itself is becoming a risk, where can they find additional sources of earnings that are genuinely different rather than simply less exposed to technology? The answer is not necessarily to move mechanically into whatever has lagged. Concentration can be reduced in several ways, but the fundamental drivers still matter.
Broadening beyond the enablers
AI enablers already account for a disproportionate share of performance in some markets. In the MSCI EMU, for example, they represent roughly 20 per cent of the index but have generated close to half of equity returns and more than half of earnings growth. That illustrates how exposure to AI can be much larger economically than its headline index weight suggests.
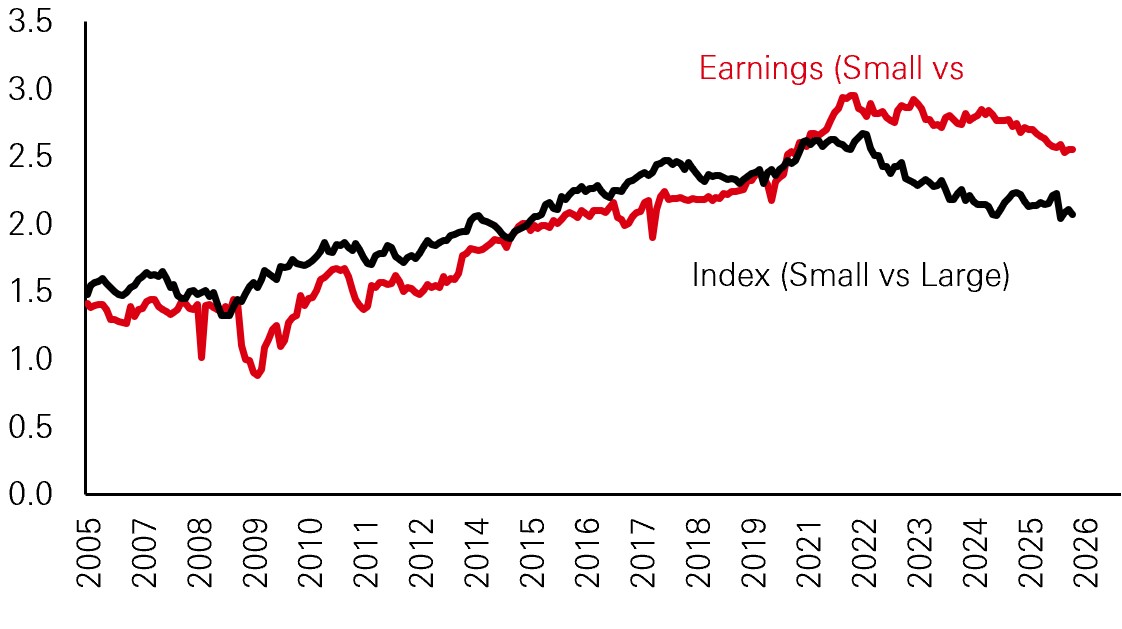
Small caps might appear to offer an obvious hedge because they contain fewer AI enablers. But their underperformance has not been caused by AI exposure alone. Weaker earnings, greater domestic sensitivity and higher exposure to interest rates have also mattered. Similarly, value strategies tend to own fewer AI winners, but also fewer companies most vulnerable to AI disruption. In both cases, stock selection has been more important than simply changing style exposure.
A potentially more durable source of broadening lies with AI adopters. These are companies that can use the technology to lift productivity or reinforce an existing earnings story without relying on AI capex as their primary growth engine.
Figure 3: Small vs large cap
Click image to enlarge
Source: HSBC AM, September 2026.
European defence is one example. Earnings have been growing at around 20 per cent year-on-year in recent years, supported by higher defence budgets and a shift in spending towards equipment and technology. AI can enhance that investment case through greater automation and technology intensity, but it is one driver among several rather than the sole reason for owning the sector.
Emerging markets offer another route. North Asia remains closely connected to semiconductor and AI infrastructure spending, but EM as a whole encompasses much broader structural forces. Demographic change, industrialisation, energy transition and financial inclusion create investment cycles driven more by domestic demand, reform and local capital formation than by global technology capex. EM companies also occupy important positions across the energy transition value chain, from commodities to batteries, storage and electric vehicles.
Valuation dispersion strengthens the case for looking across rather than simply away from the existing winners. Once sector differences are neutralised, emerging markets continue to offer a lower price for a given level of profitability than the US, even though the headline EM index itself has become increasingly technology heavy.
Geographic broadening does not necessarily provide diversification if earnings remain tied to the same global AI capex cycle. Genuine broadening requires a wider range of earnings drivers including selective exposure to AI enablers, alongside adopters, domestic growth stories and structural themes. As earnings growth normalises and the valuation support narrows, distinguishing durable profits from those dependent on continued funding, favourable pricing or policy support will become increasingly important.
1 - Global Innovation Index 2025, Innovation at a Crossroads. In top 10 rankings: Switzerland (1), Sweden (2), UK (6), Finland (7), Netherlands (8), Denmark (9).
Past performance does not predict future returns. Source: HSBC AM, October 2026. Any views expressed were held at the time of preparation and are subject to change without notice. While any forecast, projection or target where provided is indicative only and not guaranteed in any way. HSBC Global Asset Management accepts no liability for any failure to meet such forecast, projection or target. Diversification does not ensure a profit or protect against loss. For informational purposes only and should not be construed as a recommendation to invest in the specific country, product, strategy, sector, or security.
Past performance does not predict future returns.
Source: HSBC AM, October 2026. Any views expressed were held at the time of preparation and are subject to change without notice. While any forecast, projection or target where provided is indicative only and not guaranteed in any way. HSBC Global Asset Management accepts no liability for any failure to meet such forecast, projection or target. You cannot invest directly in an Index. For informational purposes only and should not be construed as a recommendation to invest in the specific country, product, strategy, sector, or security.
Important information
For Professional Clients and intermediaries within countries and territories set out below; and for Institutional Investors and Financial Advisors in the US. This document should not be distributed to or relied upon by Retail clients/investors.
The value of investments and the income from them can go down as well as up and investors may not get back the amount originally invested. The performance figures contained in this document relate to past performance, which should not be seen as an indication of future returns. Future returns will depend, inter alia, on market conditions, investment manager’s skill, risk level and fees. Where overseas investments are held the rate of currency exchange may cause the value of such investments to go down as well as up. Investments in emerging markets are by their nature higher risk and potentially more volatile than those inherent in some established markets. Economies in emerging markets generally are heavily dependent upon international trade and, accordingly, have been and may continue to be affected adversely by trade barriers, exchange controls, managed adjustments in relative currency values and other protectionist measures imposed or negotiated by the countries and territories with which they trade. These economies also have been and may continue to be affected adversely by economic conditions in the countries and territories in which they trade.
The contents of this document may not be reproduced or further distributed to any person or entity, whether in whole or in part, for any purpose. All non-authorised reproduction or use of this document will be the responsibility of the user and may lead to legal proceedings. The material contained in this document is for general information purposes only and does not constitute advice or a recommendation to buy or sell investments. Some of the statements contained in this document may be considered forward looking statements which provide current expectations or forecasts of future events. Such forward looking statements are not guarantees of future performance or events and involve risks and uncertainties. Actual results may differ materially from those described in such forward-looking statements as a result of various factors. We do not undertake any obligation to update the forward-looking statements contained herein, or to update the reasons why actual results could differ from those projected in the forward-looking statements. This document has no contractual value and is not by any means intended as a solicitation, nor a recommendation for the purchase or sale of any financial instrument in any jurisdiction in which such an offer is not lawful. The views and opinions expressed herein are those of HSBC Asset Management at the time of preparation and are subject to change at any time. These views may not necessarily indicate current portfolios' composition. Individual portfolios managed by HSBC Asset Management primarily reflect individual clients' objectives, risk preferences, time horizon, and market liquidity. Foreign and emerging markets: investments in foreign markets involve risks such as currency rate fluctuations, potential differences in accounting and taxation policies, as well as possible political, economic, and market risks. These risks are heightened for investments in emerging markets which are also subject to greater illiquidity and volatility than developed foreign markets. This commentary is for information purposes only. It is a marketing communication and does not constitute investment advice or a recommendation to any reader of this content to buy or sell investments nor should it be regarded as investment research. It has not been prepared in accordance with legal requirements designed to promote the independence of investment research and is not subject to any prohibition on dealing ahead of its dissemination. This document is not contractually binding nor are we required to provide this to you by any legislative provision.
All data from HSBC Asset Management unless otherwise specified. Any third-party information has been obtained from sources we believe to be reliable, but which we have not independently verified.
HSBC Asset Management is the brand name for the asset management business of HSBC Group, which includes the investment activities that may be provided through our local regulated entities. HSBC Asset Management is a group of companies in many countries and territories throughout the world that are engaged in investment advisory and fund management activities, which are ultimately owned by HSBC Holdings Plc. (HSBC Group).
- In Australia, this document is issued by HSBC Bank Australia Limited ABN 48 006 434 162, AFSL 232595, for HSBC Global Asset Management (Hong Kong) Limited ARBN 132 834 149 and HSBC Global Asset Management (UK) Limited ARBN 633 929 718. This document is for institutional investors only and is not available for distribution to retail clients (as defined under the Corporations Act). HSBC Global Asset Management (Hong Kong) Limited and HSBC Global Asset Management (UK) Limited are exempt from the requirement to hold an Australian financial services license under the Corporations Act in respect of the financial services they provide. HSBC Global Asset Management (Hong Kong) Limited is regulated by the Securities and Futures Commission of Hong Kong under the Hong Kong laws, which differ from Australian laws. HSBC Global Asset Management (UK) Limited is regulated by the Financial Conduct Authority of the United Kingdom and, for the avoidance of doubt, includes the Financial Services Authority of the United Kingdom as it was previously known before 1 April 2013, under the laws of the United Kingdom, which differ from Australian laws;
- In Bermuda, this document is issued by HSBC Global Asset Management (Bermuda) Limited, of 37 Front Street, Hamilton, Bermuda which is licensed to conduct investment business by the Bermuda Monetary Authority;
- In France, Belgium, Netherlands, Luxembourg, Portugal, Greece, Finland, Norway, Denmark, Spain and Sweden this document is issued by HSBC Global Asset Management (France), a Portfolio Management Company authorised by the French regulatory authority AMF (no. GP99026);
- In Germany, this document is issued by HSBC Global Asset Management (Deutschland) GmbH which is regulated by BaFin (German clients) respective by the Austrian Financial Market Supervision FMA (Austrian clients);
- In Hong Kong, this document is issued by HSBC Global Asset Management (Hong Kong) Limited, which is regulated by the Securities and Futures Commission. This content has not been reviewed by the Securities and Futures Commission;
- In India, this document is issued by HSBC Asset Management (India) Pvt Ltd. which is regulated by the Securities and Exchange Board of India;
- In Italy, this document is issued by HSBC Global Asset Management (France), a Portfolio Management Company authorised by the French regulatory authority AMF (no. GP99026), through its Italian branch, regulated by Banca d’Italia and Commissione Nazionale per le Società e la Borsa (Consob);
- In Japan, this document is issued by HSBC Asset Management (Japan) Ltd (JRN 3010001124868), regulated by the Financial Services Agency;
- In Malta, this document is issued by HSBC Global Asset Management (Malta) Limited which is regulated and licensed to conduct Investment Services by the Malta Financial Services Authority under the Investment Services Act;
- In Mexico, this document is issued by HSBC Global Asset Management (Mexico), SA de CV, Sociedad Operadora de Fondos de Inversión, Grupo Financiero HSBC which is regulated by Comisión Nacional Bancaria y de Valores;
- In the United Arab Emirates, this document is issued by HSBC Investment Funds (Luxembourg) S.A. – Dubai Branch (Level 20, HSBC Tower, PO Box 66, Downtown Dubai, United Arab Emirates) regulated by the Capital Market Authority (CMA) in the UAE to conduct investment fund management, portfolios management, fund administration activities (CMA Category 2 license No.20200000336) and promotion activities (CMA Category 5 license No.20200000327).
- In the United Arab Emirates, this document is issued by HSBC Global Asset Management MENA, a unit within HSBC Bank Middle East Limited, U.A.E Branch, PO Box 66 Dubai, UAE, regulated by the Central Bank of the U.A.E. and the Capital Market Authority in the UAE under CMA license number 602004 for the purpose of this promotion and lead regulated by the Dubai Financial Services Authority. HSBC Bank Middle East Limited is a member of the HSBC Group and HSBC Global Asset Management MENA are marketing the relevant product only in a sub-distributing capacity on a principal-to-principal basis. HSBC Global Asset Management MENA may not be licensed under the laws of the recipient’s country of residence and therefore may not be subject to supervision of the local regulator in the recipient’s country of residence. One of more of the products and services of the manufacturer may not have been approved by or registered with the local regulator and the assets may be booked outside of the recipient’s country of residence.
- In Singapore, this document is issued by HSBC Global Asset Management (Singapore) Limited, which is regulated by the Monetary Authority of Singapore. The content in the document/video has not been reviewed by the Monetary Authority of Singapore;
- In Switzerland, this document is issued by HSBC Global Asset Management (Switzerland) AG. This document is intended for professional investor use only. For opting in and opting out according to FinSA, please refer to our website; if you wish to change your client categorization, please inform us. HSBC Global Asset Management (Switzerland) AG having its registered office at Gartenstrasse 26, PO Box, CH-8002 Zurich has a licence as an asset manager of collective investment schemes and as a representative of foreign collective investment schemes. Disputes regarding legal claims between the Client and HSBC Global Asset Management (Switzerland) AG can be settled by an ombudsman in mediation proceedings. HSBC Global Asset Management (Switzerland) AG is affiliated to the ombudsman FINOS having its registered address at Talstrasse 20, 8001 Zurich. There are general risks associated with financial instruments, please refer to the Swiss Banking Association (“SBA”) Brochure “Risks Involved in Trading in Financial Instruments”;
- In Taiwan, this document is issued by HSBC Global Asset Management (Taiwan) Limited which is regulated by the Financial Supervisory Commission R.O.C. (Taiwan);
- In Turkiye, this document is issued by HSBC Asset Management A.S. Turkiye (AMTU) which is regulated by Capital Markets Board of Turkiye. Any information here is not intended to distribute in any jurisdiction where AMTU does not have a right to. Any views here should not be perceived as investment advice, product/service offer and/or promise of income. Information given here might not be suitable for all investors and investors should be giving their own independent decisions. The investment information, comments and advice given herein are not part of investment advice activity. Investment advice services are provided by authorized institutions to persons and entities privately by considering their risk and return preferences, whereas the comments and advice included herein are of a general nature. Therefore, they may not fit your financial situation and risk and return preferences. For this reason, making an investment decision only by relying on the information given herein may not give rise to results that fit your expectations.
- In the UK, this document is issued by HSBC Global Asset Management (UK) Limited, which is authorised and regulated by the Financial Conduct Authority;
- In the US, this document is issued by HSBC Securities (USA) Inc., an HSBC broker dealer registered in the US with the Securities and Exchange Commission under the Securities Exchange Act of 1934. HSBC Securities (USA) Inc. is also a member of NYSE/FINRA/SIPC. HSBC Securities (USA) Inc. is not authorized by or registered with any other non-US regulatory authority. The contents of this document are confidential and may not be reproduced or further distributed to any person or entity, whether in whole or in part, for any purpose without prior written permission.
- In Chile, operations by HSBC's headquarters or other offices of this bank located abroad are not subject to Chilean inspections or regulations and are not covered by warranty of the Chilean state. Obtain information about the state guarantee to deposits at your bank or on www.cmfchile.cl;
- In Colombia, HSBC Bank USA NA has an authorized representative by the Superintendencia Financiera de Colombia (SFC) whereby its activities conform to the General Legal Financial System. SFC has not reviewed the information provided to the investor. This document is for the exclusive use of institutional investors in Colombia and is not for public distribution;
- In Costa Rica, the Fund and any other products or services referenced in this document are not registered with the Superintendencia General de Valores (“SUGEVAL”) and no regulator or government authority has reviewed this document, or the merits of the products and services referenced herein. This document is directed at and intended for institutional investors only.
- In Peru, HSBC Bank USA NA has an authorized representative by the Superintendencia de Banca y Seguros in Perú whereby its activities conform to the General Legal Financial System - Law No. 26702. Funds have not been registered before the Superintendencia del Mercado de Valores (SMV) and are being placed by means of a private offer. SMV has not reviewed the information provided to the investor. This document is for the exclusive use of institutional investors in Perú and is not for public distribution;
- In Uruguay, operations by HSBC's headquarters or other offices of this bank located abroad are not subject to Uruguayan inspections or regulations and are not covered by warranty of the Uruguayan state. Further information may be obtained about the state guarantee to deposits at your bank or on www.bcu.gub.uy.
Copyright © HSBC Global Asset Management Limited 2026. All rights reserved. No part of this publication may be reproduced, stored in a retrieval system, or transmitted, on any form or by any means, electronic, mechanical, photocopying, recording, or otherwise, without the prior written permission of HSBC Asset Management.
Content ID: D079592_v1.0; Expiry Date: 30.09.2027