

Fixed Income Insights
In a nutshell
Key takeaways
- AI is becoming a financing story as well as an earnings story. Hyperscaler investment is increasingly moving beyond what operating cash flow alone can fund, raising reliance on external capital.
- Higher borrowing does not automatically mean weaker credit. The sustainability of the investment cycle depends on asset lives, utilization, contracted revenues and the pace at which new infrastructure begins to generate cash
- Headline debt captures only part of the risk. Leases, guarantees and other off balance sheet commitments are becoming more important, increasing the need to distinguish between growth that is already funded and growth still dependent on the future market access
- The same technology cycle is producing different credit outcomes across regions. US public markets are absorbing much of the bond supply, Asian investment remains more bank and project financed, while Europe hosts substantial infrastructure investment without carrying the same corporate financing burden
Funding the AI frontier
AI’s capital-intensive build-out is outgrowing hyperscaler cash flows, increasing reliance on external finance. Credit outcomes will depend on monetisation, secured funding and liability location, with risks differing materially across regions.
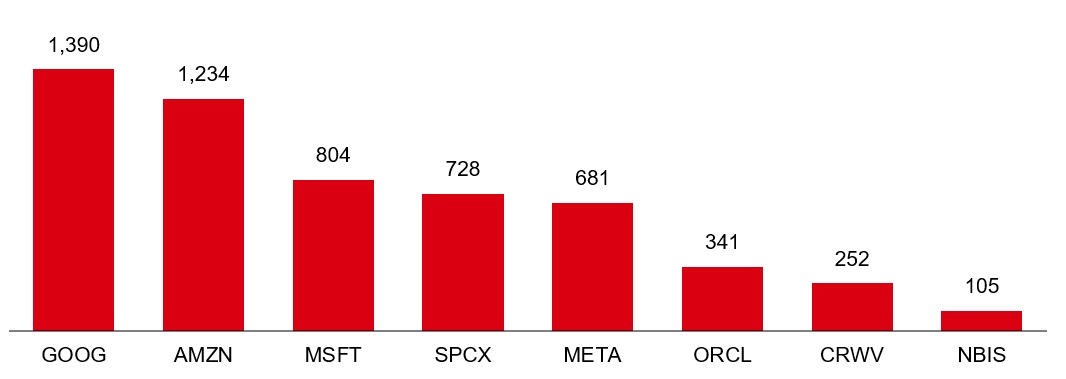
With combined hyperscaler capital expenditure expected to exceed USD 5tn between 2026 and 2029, the AI build out has moved beyond what operating cash flow can fund.
The buildout increasingly relies on external capital. The unsecured bond market remains the main source, with investment grade hyperscalers having issued around USD 250bn across seven currencies. A further USD 250bn of issuance is expected in 2027, with potential upside if investment plans continue to increase.The underlying AI investment case may remain intact, but a sustained rise in borrowing can still create a more difficult technical backdrop for spreads.
Figure 1: Combined hyperscaler capex, FY26-FY29 (USD bn)
Click the image to enlarge
Source: HSBC Asset Management, Bloomberg, S&P, September 2026.
However, headline public bond issuance is only part of the story. AI is increasingly being financed through a wider mix of bonds, leases, bank loans, project structures, guarantees and other off-balance sheet arrangements. For investors, understanding where the obligation ultimately sits is becoming increasingly important.
Large funding requirements do not necessarily mean poor economics.
The AI build out combines assets with very different economic lives. Much depends on the nature of the assets being financed, how long they remain useful and how quickly they begin to generate cash.
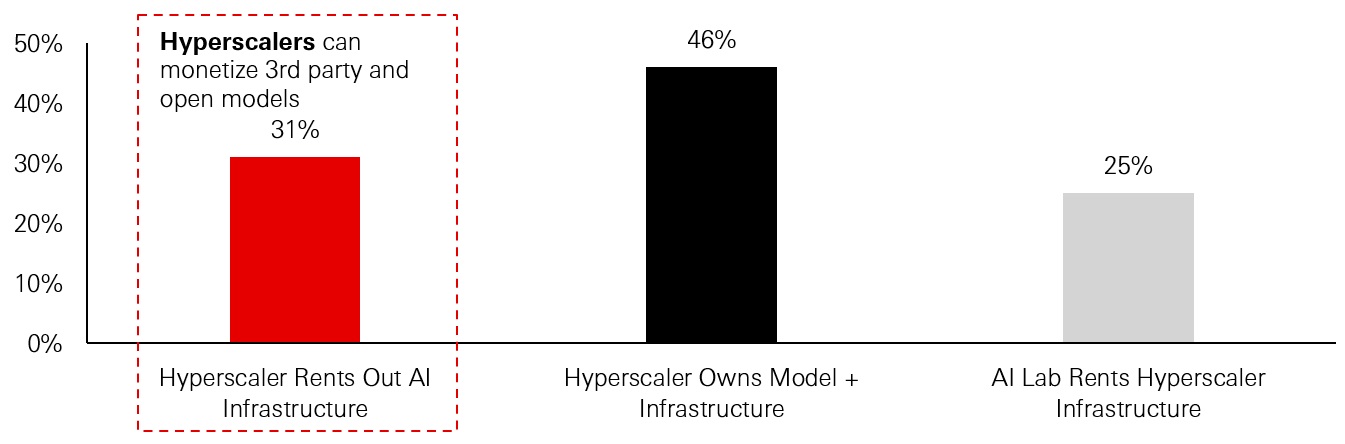
Figure 2: AI stack contribution to return on invested capital (per cent)
Click the image to enlarge
Source: HSBC Asset Management, Morgan Stanley Research, Amazon Q2’26 Earnings Call, Illustrative Purposes, September 2026.
Most AI capacity is being contracted for at least five years, giving stronger issuers greater visibility over the revenues against which they are borrowing. The shortest lived computing equipment may require frequent replacement as technology improves, but much of the supporting infrastructure does not. Servers and networking equipment, for example, can reach break even in less than three years but with useful lives of around just five to six years. Buildings and power infrastructure last considerably longer and can support several generations of equipment- a data centre shell, grid connection or cooling system can continue to generate value through multiple technology cycles. Assessing the entire investment against the replacement cycle of chips therefore risks overstating the effective capital burden.
Monetisation can also take several forms. Hyperscalers can rent directly to AI laboratories and enterprises, while their own models can generate additional demand for cloud infrastructure. As capacity comes online, contracted backlogs can convert into revenue, while AI can support adjacent businesses including software, search, e-commerce, databases, networking and security. The ability to monetise the same infrastructure through multiple channels helps explain why large upfront investment can still generate attractive economics.
The investment can therefore work if demand arrives broadly as expected. If monetisation takes longer, utilisation disappoints or capacity is built ahead of demand, the same fixed cost infrastructure becomes more difficult to absorb.
At the same time, falling AI model prices could change where the returns accrue but may not be necessarily negative for the infrastructure layer.
Open AI models are rapidly closing part of the performance gap with proprietary frontier models, while cheaper alternatives are becoming sufficient for a growing range of enterprise tasks. That could put pressure on the pricing power of individual model developers, particularly where users do not require the most capable model for every task.
For infrastructure providers such as the hyperscalers, however, cheaper AI can stimulate adoption. More usage still requires computing capacity, storage, networking and security, and most enterprises are unlikely to build those capabilities themselves. A more fragmented model market can therefore coexist with rising demand for the underlying infrastructure.
This means that lower model prices can compress returns in one layer while increasing volumes in another. The credit question is consequently not simply whether AI usage grows, but where the revenues and cash flows generated by that usage ultimately accrue.
Top-down estimates may overestimate funding needs compared to issuer-level analysis, while strong credit quality may coexist with elevated issuance and wider spreads driven by market supply.
A top-down calculation that assumes around 30 per cent of hyperscaler capex is funded with unsecured debt produces a materially larger funding requirement than building estimates issuer by issuer. The difference reflects the flexibility available to the largest companies. Investment plans extend over several years, cash balances remain substantial and issuers can alter the timing and mix of bonds, leases and other forms of financing while raising capital.
Even so, issuance is likely to remain elevated. Strong fundamentals and heavy supply can coexist as companies may remain highly creditworthy. But investors may still demand more spread simply to absorb repeated new issuance.
This distinction between fundamental credit quality and market technicals is likely to become increasingly important. Strong earnings can keep leverage manageable, yet an unusually large volume of bonds can still affect relative value.
The funding picture is more complicated than bond supply alone. As leases, guarantees and other off-balance sheet structures become more prevalent, it is important to identify where the economic obligation ultimately sits.
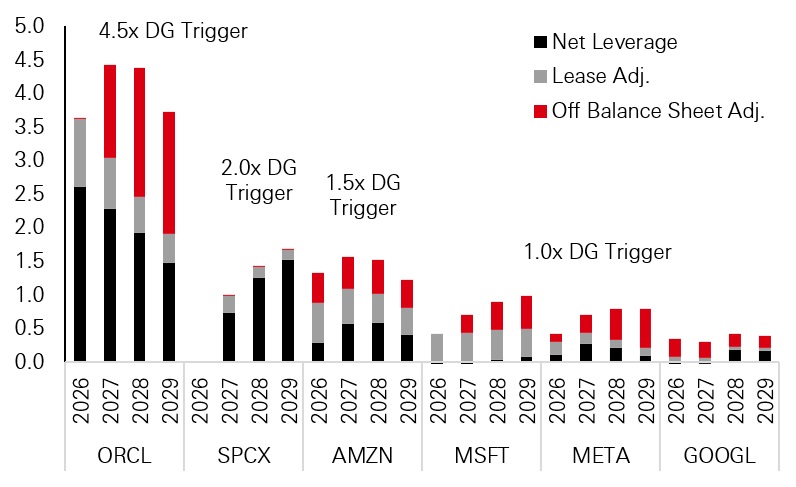
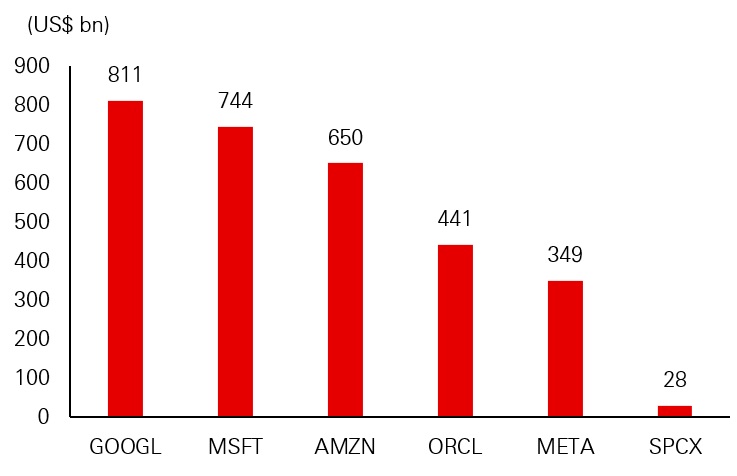
Traditional leverage captures bonds, loans and recognised lease obligations. However, the AI build out increasingly creates commitments that do not initially appear as conventional debt. A data centre lease, for example, may already be contractually committed while the facility is still under construction. Residual value guarantees can similarly create an economic liability where the future value of a data centre or a pool of chips falls below the amount guaranteed. Certain unavoidable purchase or energy commitments may also have debt-like characteristics.
While adjustments can be made by using reported debt and lease obligations as the starting point and then incorporating future leases and other off-balance-sheet commitments into adjusted leverage. The difficulty is that disclosure remains uneven, requiring assumptions about when commitments begin, how long they run and how much residual value remains.
For some of the larger hyperscalers, incorporating these commitments can bring adjusted leverage closer to rating agency thresholds even while underlying credit fundamentals remain strong. Yet that need not translate into a downgrade. Robust earnings, growing contracted revenues and the productive use of new borrowing can provide capacity to absorb this higher leverage.
Figure 3: All-in net leverage by hyperscaler
Click the image to enlarge
Figure 4: Purchase commitments that may not be included
Click the image to enlarge
Source: HSBC AM, company filings, S&P. Data as of September 2026.
Across the sector, therefore, rising leverage needs to be assessed alongside earnings, cash flow, liquidity and the pace at which new capacity begins to monetise. Greater disclosure should gradually make this easier. Accounting developments around AI related capital commitments and contingent liabilities could give investors a clearer picture of exposures that today often require significant estimation. But until disclosure catches up with financial innovation, headline debt alone will remain an incomplete measure.
For much of the past 18 months, credit markets have rewarded exposure to AI growth with relatively little distinction between how that growth was financed. That may become harder to sustain as the capital demands increase.
A company with committed capital, contracted revenues and sufficient liquidity to complete its development pipeline is fundamentally different from one that still requires repeated access to debt and equity markets. The first can focus largely on execution; the second must successfully finance each additional stage of growth.
Investment grade tenants, residual value protection, amortising debt and revenues that begin once a facility is delivered can reduce reliance on future refinancing. The relevant question is therefore not simply how large the development pipeline is. It is how much additional capital still needs to be raised before that pipeline begins producing cash.
In this way, apparently similar AI exposures can deserve very different credit treatment. Two borrowers can have comparable growth prospects but significantly different financing risks if one has already secured its capital and the other remains dependent on future market access.
The funding challenge is not confined to the hyperscalers.
Semiconductor manufacturers and other participants in the AI supply chain are increasingly supporting customers through equity investments, guarantees and other financing arrangements. Strategically, this can support demand for their own products. From a credit perspective, however, it creates a second layer of exposure.
The size of these commitments can be large, but their effect depends on whether they are contingent or already drawn, how quickly they build, the value of the underlying collateral, and the issuer’s ability to generate free cash flow over the same period.
The distinction in how structure, timing and location of the funding determines the credit outcome becomes clearer when the same investment cycle is viewed across different regions.
The AI build out is global, but the financial systems supporting it are different. Those differences determine where public bond supply appears, which balance sheets carry the leverage and how quickly financing pressure reaches credit markets.
1. US: public markets absorb the build-out.
The US sits at the centre of AI capex and relies heavily on deep public capital markets. Large investment grade issuers can access unsecured bonds at scale, while leases, project structures and other off-balance sheet arrangements provide additional channels.
That breadth of financing is a strength because it allows very large investment programmes to proceed without depending on any single source of capital. Yet the public credit market is having to do much of the heavy lifting.
Whether earnings and monetisation can keep pace with the capital being raised while investors continue to absorb repeated issuance without requiring materially wider spreads is a key question.
There are also regulatory and execution constraints. Federal policy remains broadly supportive of maintaining US leadership in AI, but state and local resistance to data centre development has increased. So far, that pushback has generally resulted in delays or pauses rather than outright prohibitions. Restrictions on new projects could also increase the value of capacity that has already secured power, land and permitting.
2. Asia: financing has so far been less reliant on debt capital markets, but the scope for bond supply is emerging.
Asia is the world’s second largest data centre market and capacity could more than double by 2030, with China the largest market and several South and Southeast Asian markets among the faster growing locations. Associated infrastructure investment could reach around USD 500bn, compared with roughly USD 2.5tn in the US.
Much of the associated investment has not so far been raised via public bond markets, but through banks, construction loans, project finance and private capital, which remain the dominant funding sources for physical infrastructure. Equity sponsors frequently include global private equity and infrastructure funds, while tenants – including both Asian and US hyperscalers – fund much of chip and server investment. Power requirements are financed by utilities.
Figure 5: Funding party of capex
| Core, shell and critical infra. | 30% | DC developer / operator | Equity: Global PEs, Infra funds Debt: Bank construction loans, project loans |
| Chips and servers | 50% | Tenant / Hyperscaler | Corporate cash flows, balance sheet. GPU financing emerging |
| Power generation | 20% | Utilities | Traditional utility-led. Co-fund with developers emerging |
Source: BNP, Goldman, HSBC AM? September 2026.
Note: * Referencing US mix. Data as of September 2026.
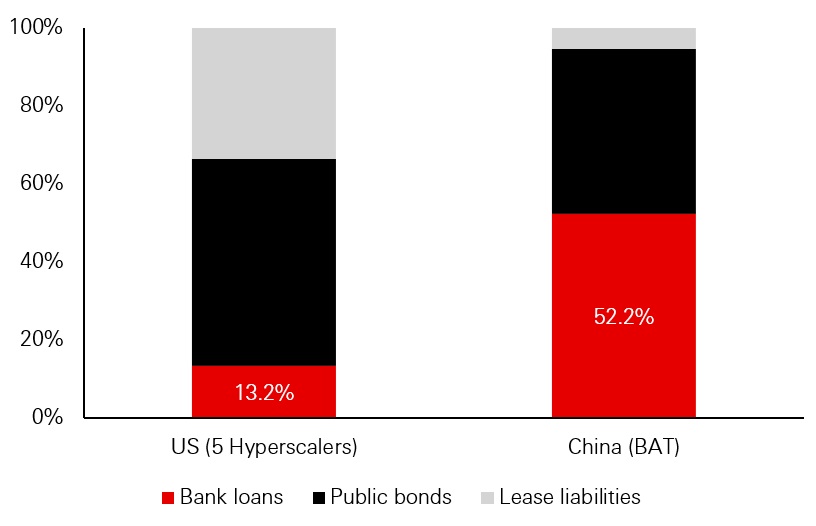
Figure 6: Aggregate debt funding mix (1H26)
Click the image to enlarge
Source: HSBC AM, Bloomberg. Data as of September 2026.
China has a regional financing advantage. Project loans can be priced below 3 per cent with maturities of 10–15 years, compared with roughly 6 per cent and shorter tenors in several other Asian markets. Public data centre bonds remain comparatively rare. Chinese hyperscalers make much greater use of bank financing than US peers. Bank loans account for more than half of their debt – around four times the share seen among similar US firms.
AI economics within China are different
Domestic models have become increasingly competitive while remaining cheaper to use. Consumer adoption benefits from large digital ecosystems in which AI can be embedded into existing applications spanning commerce, entertainment, social networking and payments. That creates a large potential user base and multiple routes to monetisation.
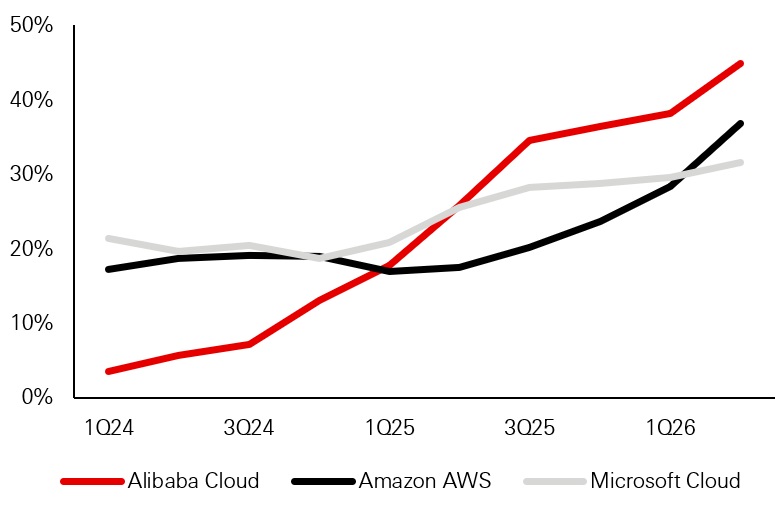
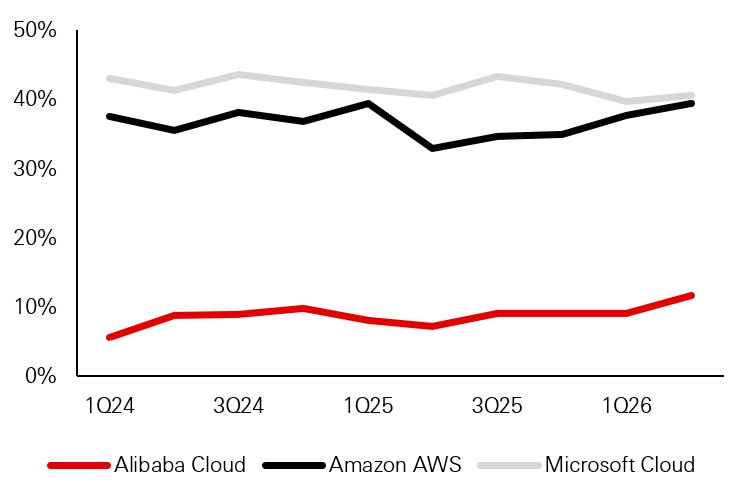
The harder question is whether usage converts into margins and cash flow. Cloud remains the clearest near term monetisation channel, but it is earlier in its development than in the US and domestic competition is intense.
Figure 7: AliCloud revenue growth (y/y) versus US peers
Click the image to enlarge
Figure 8: AliCloud EBIT margin versus US peers
Click the image to enlarge
Source: HSBC AM, Bloomberg. Data as of September 2026.
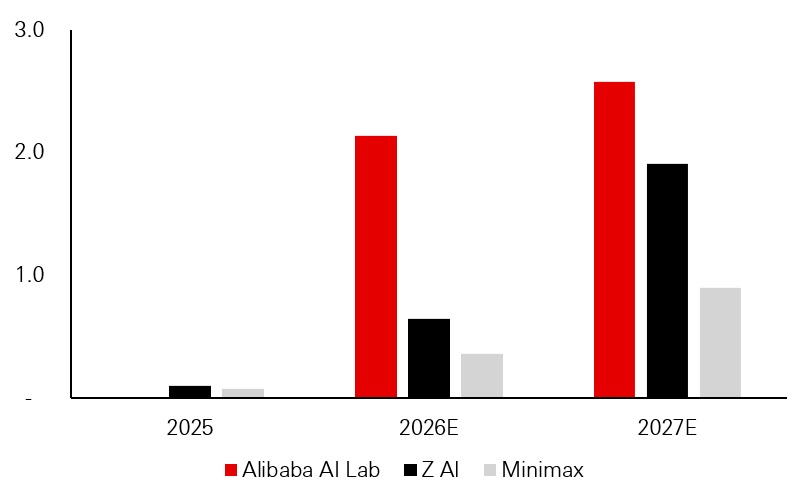
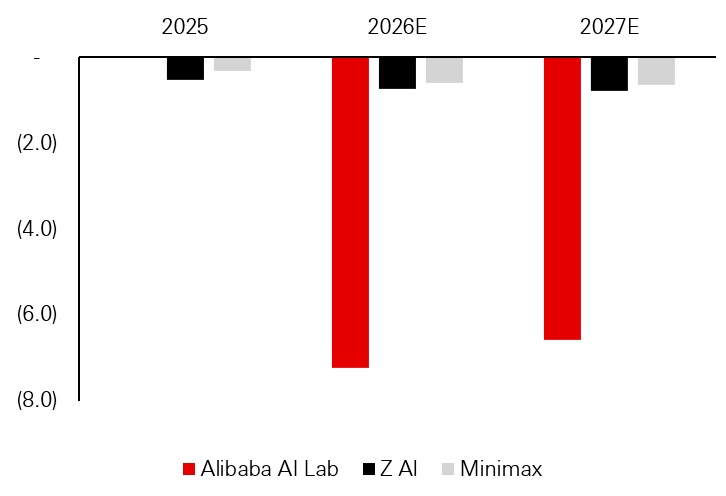
At the model layer, revenues are emerging but operating losses are expected to persist through 2027 as enterprise monetisation remains immature and competition among developers remains intense.
Figure 9: AI Labs’ Revenue (USD bn)
Click the image to enlarge
Figure 10: AI Labs’ EBIT loss
Click the image to enlarge
Source: HSBC AM, Bloomberg. Data as of September 2026.
This creates another version of the same credit question seen in the US: how long can investment run ahead of monetisation? There is also a potentially important upside risk. If lower cost models stimulate much broader usage, demand for computing capacity could rise faster than currently assumed, shifting the constraint away from model capability and towards the availability of infrastructure and funding. China’s state supported data centre build out could become particularly relevant in that scenario.
Not all parts of the Asian AI ecosystem face the same funding challenge.
Memory and semiconductor producers are among the most direct beneficiaries of the global infrastructure cycle. Strong demand is translating into sharply higher earnings and free cash flow for several major producers, helping improve net cash positions and rating momentum. The cyclicality of memory remains an important risk, but retaining substantial cash during the upswing can create a much stronger balance sheet cushion for the next downturn.
3. Europe: infrastructure without the same financing burden.
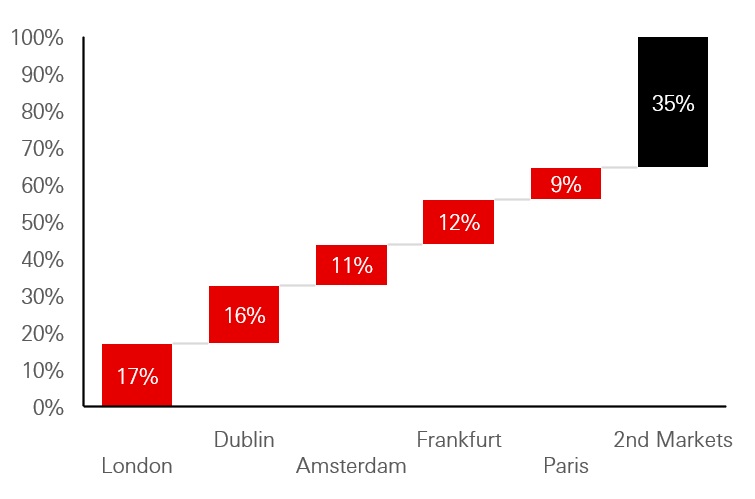
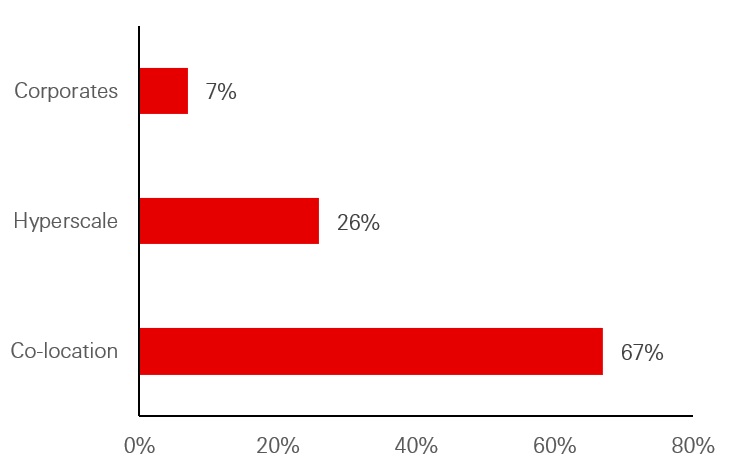
Europe’s data centre market is smaller than that of the US and Asia and more constrained by power availability, grid connections, land and planning. Around 65 per cent of operational capacity remains concentrated in the major Frankfurt, London, Amsterdam, Paris and Dublin hubs, although secondary locations in the Nordics and Southern Europe are beginning to grow. Hyperscalers account directly for only around a quarter of continental European capacity.
Figure 11: Operational capacity within region (per cent)
Click the image to enlarge
Figure 12: European capacity breakdown (per cent)
Click the image to enlarge
Source: HSBC AM, Bloomberg. Data as of September 2026.
Europe also has less locally available capital for data centre development than the US, while planning and regulation are fragmented across and within countries. These constraints can slow development even where national governments are supportive. Funding therefore looks different again. Bank lending remains the main source for European data centres, with private credit also active. But hyperscaler issuance is now accounting for around 9 per cent of euro investment grade supply, and securitisation is beginning to emerge as an alternative source of funding.
An estimated 70–80 per cent of AI investment in Europe is being undertaken by US hyperscalers. Europe is therefore hosting a growing share of AI infrastructure without European corporates carrying the same financing burden. That shifts the European credit story towards the companies supplying the infrastructure such as semiconductor equipment, power electronics, engineering, cooling, networking, electrical systems and enterprise software. Many of these businesses can gain AI related revenue without undertaking hyperscaler level capex themselves.
A regional overview helps to understand the nuances of the AI credit landscape.
In the US, the key risk is that monetisation disappoints or takes longer than expected while leverage and external financing continue to rise. Overbuilding, financial complexity and regulatory delays could all increase pressure.
In Asia, three risks stand out. Bank funded investment could migrate towards public bonds and create new supply; monetisation may not generate enough cash to support the investment being made; and sanctions or tighter export restrictions could disrupt parts of the Chinese ecosystem.
In Europe, the financing risk is smaller, but power availability, planning and fragmented regulation may restrict development. The investment question is also increasingly one of valuation i.e. where balance sheets are strong and capex requirements manageable, spreads may already capture much of the benefit.
The scale of investment remains substantial, but large capital requirements do not automatically imply weak credit.
The outcome depends on whether assets generate cash quickly enough, how much financing has already been secured and who ultimately bears the economic liabilities. Productive assets, long contracted revenues, strong free cash flow and diversified funding sources can all support additional leverage.
Fixed-income investors need to make the distinction between companies that have the capital, liquidity and contracted demand to execute their plans and those whose growth still depends on repeated access to financing.
The same technology cycle is being financed through public bonds in the US, bank and project finance in Asia, and largely externally funded infrastructure in Europe, making the structure of financing, rather than the technology theme alone, central to assessing global credit exposure.
Source: HSBC Asset Management, November 2026.
The views expressed above were held at the time of preparation and are subject to change without notice. Any forecast, projection or target where provided is indicative only and not guaranteed in any way. HSBC Asset Management accepts no liability for any failure to meet such forecast, projection or target.
Continue reading: Rates: A global reset
Important information
For Professional Clients and intermediaries within countries and territories set out below; and for Institutional Investors and Financial Advisors in the US. This document should not be distributed to or relied upon by Retail clients/investors.
The value of investments and the income from them can go down as well as up and investors may not get back the amount originally invested. The performance figures contained in this document relate to past performance, which should not be seen as an indication of future returns. Future returns will depend, inter alia, on market conditions, investment manager’s skill, risk level and fees. Where overseas investments are held the rate of currency exchange may cause the value of such investments to go down as well as up. Investments in emerging markets are by their nature higher risk and potentially more volatile than those inherent in some established markets. Economies in emerging markets generally are heavily dependent upon international trade and, accordingly, have been and may continue to be affected adversely by trade barriers, exchange controls, managed adjustments in relative currency values and other protectionist measures imposed or negotiated by the countries and territories with which they trade. These economies also have been and may continue to be affected adversely by economic conditions in the countries and territories in which they trade.
The contents of this document may not be reproduced or further distributed to any person or entity, whether in whole or in part, for any purpose. All non-authorised reproduction or use of this document will be the responsibility of the user and may lead to legal proceedings. The material contained in this document is for general information purposes only and does not constitute advice or a recommendation to buy or sell investments. Some of the statements contained in this document may be considered forward looking statements which provide current expectations or forecasts of future events. Such forward looking statements are not guarantees of future performance or events and involve risks and uncertainties. Actual results may differ materially from those described in such forward-looking statements as a result of various factors. We do not undertake any obligation to update the forward-looking statements contained herein, or to update the reasons why actual results could differ from those projected in the forward-looking statements. This document has no contractual value and is not by any means intended as a solicitation, nor a recommendation for the purchase or sale of any financial instrument in any jurisdiction in which such an offer is not lawful. The views and opinions expressed herein are those of HSBC Asset Management at the time of preparation and are subject to change at any time. These views may not necessarily indicate current portfolios' composition. Individual portfolios managed by HSBC Asset Management primarily reflect individual clients' objectives, risk preferences, time horizon, and market liquidity. Foreign and emerging markets: investments in foreign markets involve risks such as currency rate fluctuations, potential differences in accounting and taxation policies, as well as possible political, economic, and market risks. These risks are heightened for investments in emerging markets which are also subject to greater illiquidity and volatility than developed foreign markets. This commentary is for information purposes only. It is a marketing communication and does not constitute investment advice or a recommendation to any reader of this content to buy or sell investments nor should it be regarded as investment research. It has not been prepared in accordance with legal requirements designed to promote the independence of investment research and is not subject to any prohibition on dealing ahead of its dissemination. This document is not contractually binding nor are we required to provide this to you by any legislative provision.
All data from HSBC Asset Management unless otherwise specified. Any third-party information has been obtained from sources we believe to be reliable, but which we have not independently verified.
HSBC Asset Management is the brand name for the asset management business of HSBC Group, which includes the investment activities that may be provided through our local regulated entities. HSBC Asset Management is a group of companies in many countries and territories throughout the world that are engaged in investment advisory and fund management activities, which are ultimately owned by HSBC Holdings Plc. (HSBC Group).
- In Australia, this document is issued by HSBC Bank Australia Limited ABN 48 006 434 162, AFSL 232595, for HSBC Global Asset Management (Hong Kong) Limited ARBN 132 834 149 and HSBC Global Asset Management (UK) Limited ARBN 633 929 718. This document is for institutional investors only and is not available for distribution to retail clients (as defined under the Corporations Act). HSBC Global Asset Management (Hong Kong) Limited and HSBC Global Asset Management (UK) Limited are exempt from the requirement to hold an Australian financial services license under the Corporations Act in respect of the financial services they provide. HSBC Global Asset Management (Hong Kong) Limited is regulated by the Securities and Futures Commission of Hong Kong under the Hong Kong laws, which differ from Australian laws. HSBC Global Asset Management (UK) Limited is regulated by the Financial Conduct Authority of the United Kingdom and, for the avoidance of doubt, includes the Financial Services Authority of the United Kingdom as it was previously known before 1 April 2013, under the laws of the United Kingdom, which differ from Australian laws;
- In Bermuda, this document is issued by HSBC Global Asset Management (Bermuda) Limited, of 37 Front Street, Hamilton, Bermuda which is licensed to conduct investment business by the Bermuda Monetary Authority;
- In France, Belgium, Netherlands, Luxembourg, Portugal, Greece, Finland, Norway, Denmark, Spain and Sweden this document is issued by HSBC Global Asset Management (France), a Portfolio Management Company authorised by the French regulatory authority AMF (no. GP99026);
- In Germany, this document is issued by HSBC Global Asset Management (Deutschland) GmbH which is regulated by BaFin (German clients) respective by the Austrian Financial Market Supervision FMA (Austrian clients);
- In Hong Kong, this document is issued by HSBC Global Asset Management (Hong Kong) Limited, which is regulated by the Securities and Futures Commission. This content has not been reviewed by the Securities and Futures Commission;
- In India, this document is issued by HSBC Asset Management (India) Pvt Ltd. which is regulated by the Securities and Exchange Board of India;
- In Italy, this document is issued by HSBC Global Asset Management (France), a Portfolio Management Company authorised by the French regulatory authority AMF (no. GP99026), through its Italian branch, regulated by Banca d’Italia and Commissione Nazionale per le Società e la Borsa (Consob);
- In Japan, this document is issued by HSBC Asset Management (Japan) Ltd (JRN 3010001124868), regulated by the Financial Services Agency;
- In Malta, this document is issued by HSBC Global Asset Management (Malta) Limited which is regulated and licensed to conduct Investment Services by the Malta Financial Services Authority under the Investment Services Act;
- In Mexico, this document is issued by HSBC Global Asset Management (Mexico), SA de CV, Sociedad Operadora de Fondos de Inversión, Grupo Financiero HSBC which is regulated by Comisión Nacional Bancaria y de Valores;
- In the United Arab Emirates, this document is issued by HSBC Investment Funds (Luxembourg) S.A. – Dubai Branch (Level 20, HSBC Tower, PO Box 66, Downtown Dubai, United Arab Emirates) regulated by the Capital Market Authority (CMA) in the UAE to conduct investment fund management, portfolios management, fund administration activities (CMA Category 2 license No.20200000336) and promotion activities (CMA Category 5 license No.20200000327).
- In the United Arab Emirates, this document is issued by HSBC Global Asset Management MENA, a unit within HSBC Bank Middle East Limited, U.A.E Branch, PO Box 66 Dubai, UAE, regulated by the Central Bank of the U.A.E. and the Capital Market Authority in the UAE under CMA license number 602004 for the purpose of this promotion and lead regulated by the Dubai Financial Services Authority. HSBC Bank Middle East Limited is a member of the HSBC Group and HSBC Global Asset Management MENA are marketing the relevant product only in a sub-distributing capacity on a principal-to-principal basis. HSBC Global Asset Management MENA may not be licensed under the laws of the recipient’s country of residence and therefore may not be subject to supervision of the local regulator in the recipient’s country of residence. One of more of the products and services of the manufacturer may not have been approved by or registered with the local regulator and the assets may be booked outside of the recipient’s country of residence.
- In Singapore, this document is issued by HSBC Global Asset Management (Singapore) Limited, which is regulated by the Monetary Authority of Singapore. The content in the document/video has not been reviewed by the Monetary Authority of Singapore;
- In Switzerland, this document is issued by HSBC Global Asset Management (Switzerland) AG. This document is intended for professional investor use only. For opting in and opting out according to FinSA, please refer to our website; if you wish to change your client categorization, please inform us. HSBC Global Asset Management (Switzerland) AG having its registered office at Gartenstrasse 26, PO Box, CH-8002 Zurich has a licence as an asset manager of collective investment schemes and as a representative of foreign collective investment schemes. Disputes regarding legal claims between the Client and HSBC Global Asset Management (Switzerland) AG can be settled by an ombudsman in mediation proceedings. HSBC Global Asset Management (Switzerland) AG is affiliated to the ombudsman FINOS having its registered address at Talstrasse 20, 8001 Zurich. There are general risks associated with financial instruments, please refer to the Swiss Banking Association (“SBA”) Brochure “Risks Involved in Trading in Financial Instruments”;
- In Taiwan, this document is issued by HSBC Global Asset Management (Taiwan) Limited which is regulated by the Financial Supervisory Commission R.O.C. (Taiwan);
- In Turkiye, this document is issued by HSBC Asset Management A.S. Turkiye (AMTU) which is regulated by Capital Markets Board of Turkiye. Any information here is not intended to distribute in any jurisdiction where AMTU does not have a right to. Any views here should not be perceived as investment advice, product/service offer and/or promise of income. Information given here might not be suitable for all investors and investors should be giving their own independent decisions. The investment information, comments and advice given herein are not part of investment advice activity. Investment advice services are provided by authorized institutions to persons and entities privately by considering their risk and return preferences, whereas the comments and advice included herein are of a general nature. Therefore, they may not fit your financial situation and risk and return preferences. For this reason, making an investment decision only by relying on the information given herein may not give rise to results that fit your expectations.
- In the UK, this document is issued by HSBC Global Asset Management (UK) Limited, which is authorised and regulated by the Financial Conduct Authority;
- In the US, this document is issued by HSBC Securities (USA) Inc., an HSBC broker dealer registered in the US with the Securities and Exchange Commission under the Securities Exchange Act of 1934. HSBC Securities (USA) Inc. is also a member of NYSE/FINRA/SIPC. HSBC Securities (USA) Inc. is not authorized by or registered with any other non-US regulatory authority. The contents of this document are confidential and may not be reproduced or further distributed to any person or entity, whether in whole or in part, for any purpose without prior written permission.
- In Chile, operations by HSBC's headquarters or other offices of this bank located abroad are not subject to Chilean inspections or regulations and are not covered by warranty of the Chilean state. Obtain information about the state guarantee to deposits at your bank or on www.cmfchile.cl;
- In Colombia, HSBC Bank USA NA has an authorized representative by the Superintendencia Financiera de Colombia (SFC) whereby its activities conform to the General Legal Financial System. SFC has not reviewed the information provided to the investor. This document is for the exclusive use of institutional investors in Colombia and is not for public distribution;
- In Costa Rica, the Fund and any other products or services referenced in this document are not registered with the Superintendencia General de Valores (“SUGEVAL”) and no regulator or government authority has reviewed this document, or the merits of the products and services referenced herein. This document is directed at and intended for institutional investors only.
- In Peru, HSBC Bank USA NA has an authorized representative by the Superintendencia de Banca y Seguros in Perú whereby its activities conform to the General Legal Financial System - Law No. 26702. Funds have not been registered before the Superintendencia del Mercado de Valores (SMV) and are being placed by means of a private offer. SMV has not reviewed the information provided to the investor. This document is for the exclusive use of institutional investors in Perú and is not for public distribution;
- In Uruguay, operations by HSBC's headquarters or other offices of this bank located abroad are not subject to Uruguayan inspections or regulations and are not covered by warranty of the Uruguayan state. Further information may be obtained about the state guarantee to deposits at your bank or on www.bcu.gub.uy.
Copyright © HSBC Global Asset Management Limited 2026. All rights reserved. No part of this publication may be reproduced, stored in a retrieval system, or transmitted, on any form or by any means, electronic, mechanical, photocopying, recording, or otherwise, without the prior written permission of HSBC Asset Management.
Content ID:D082976_v 1.0; Expiry Date: 31.05.2027


